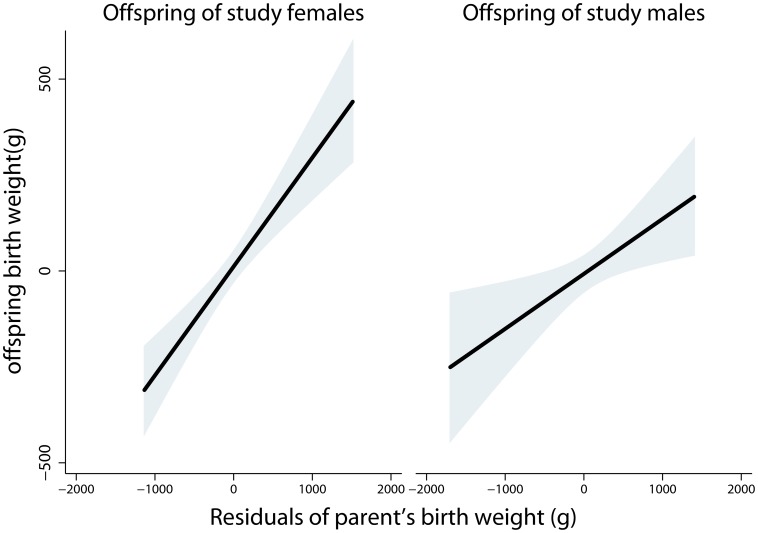
Figure 2. Best fitting regression lines (shaded area = 95% CI) relating offspring BW to maternal BW (n = 675) and father’s BW (n = 426). Parental BW plotted as residuals adjusted for parent’s gestational age at birth.
Offspring BW plotted as residuals adjusted for mother’s age, offspring’s gestational age at birth, first born status, offspring sex, prenatal care, and mother’s work status during pregnancy (sex of parent by parental BW interaction p = 0.074).

