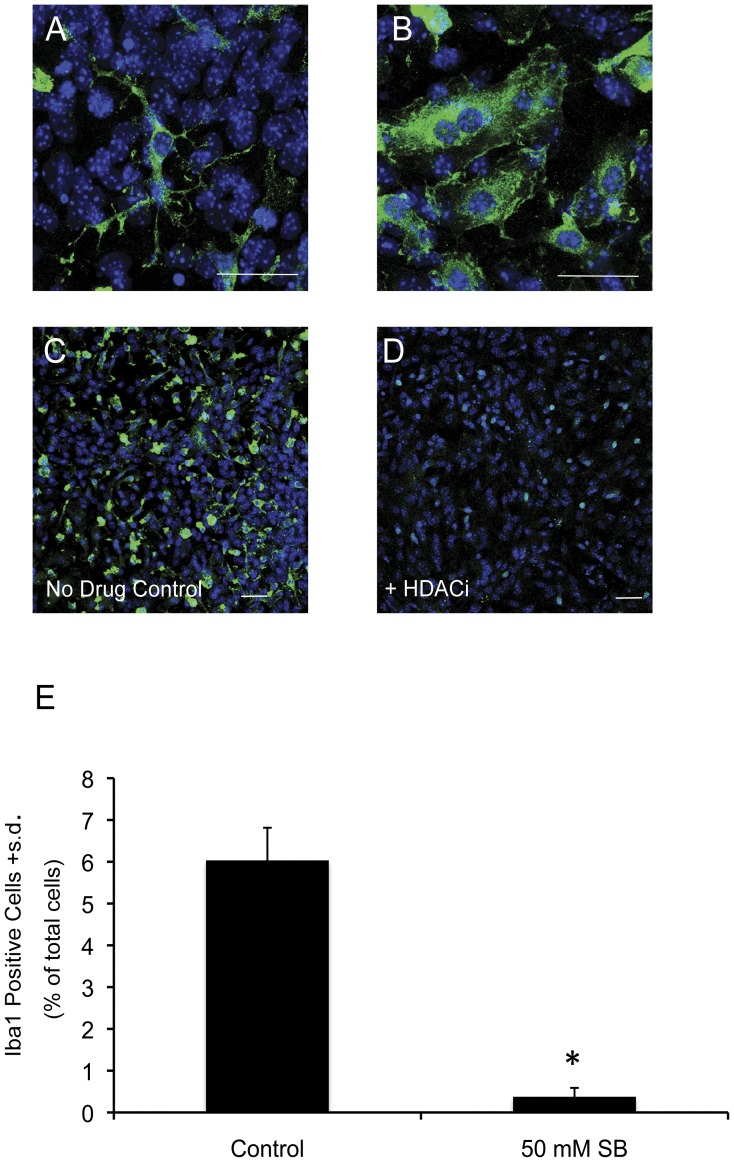
Figure 6. Effects of HDACi treatment on microglia in midbrain cultures. (.
A) Iba1 positive microglial cell displaying a ramified morphology. (B) Iba1 positive amoeboid microglia. (C) Iba1 positive cells in an untreated, control midbrain culture. (D) Treatment with 50 mM SB for 48 hours significantly reduces the number of Iba1 positive cells in midbrain cultures. (E) Quantification of the decrease in Iba1 positive cells as a result of HDACi treatment. Bars represent the mean + s.d. (n = 4). Asterisk (*) indicates that SB only treatment group is significantly different (p<0.05) from the control treated group as determined by an unpaired Student’s t-test. Scale bars = 50 µM. Blue = DAPI positive nuclei, green = Iba1.

