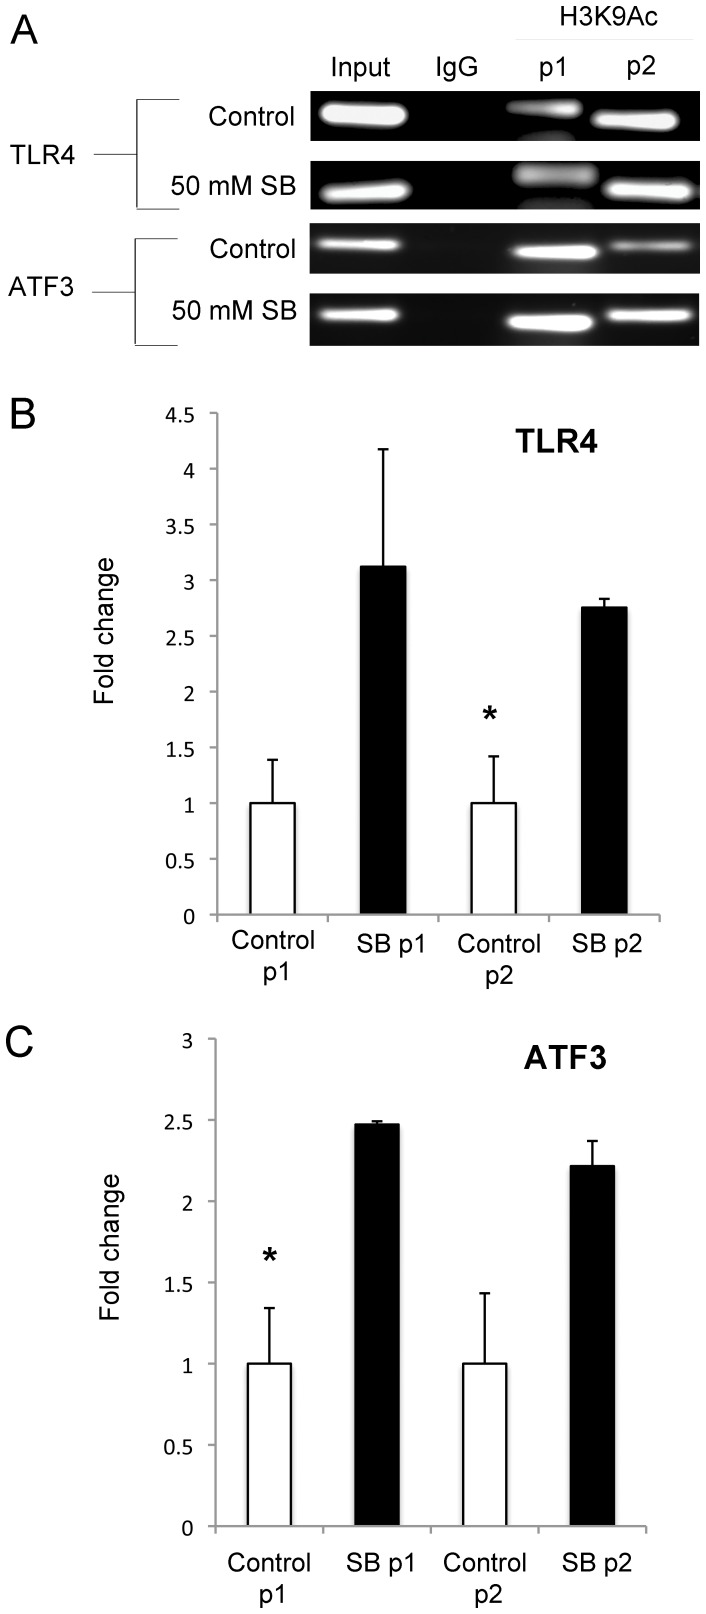
Figure 8. ChIP-qPCR at the TLR4 and ATF3 loci.
(A) Representative results of qPCR experiments amplifying two separate regions of the TLR4 and ATF3 gene promoters (separate p1 and p2 primer sets for each gene) after enrichment of H3K9Ac-DNA complexes from cells obtained after SB treatment or controls. Input = purified DNA before selection; IgG = control for non-specific antibody binding to DNA. Quantitative PCR was used to determine that the TLR4 locus (B) and the ATF3 locus (C) were enriched for H3K9Ac at two separate promoter locations after 48 hours of SB treatment. Bars represent the mean fold change + s.d. (n = 3). Asterisk (*) indicates that SB treatment group is significantly different (p<0.05) from the control treated group as determined by an unpaired Student’s t-test.

