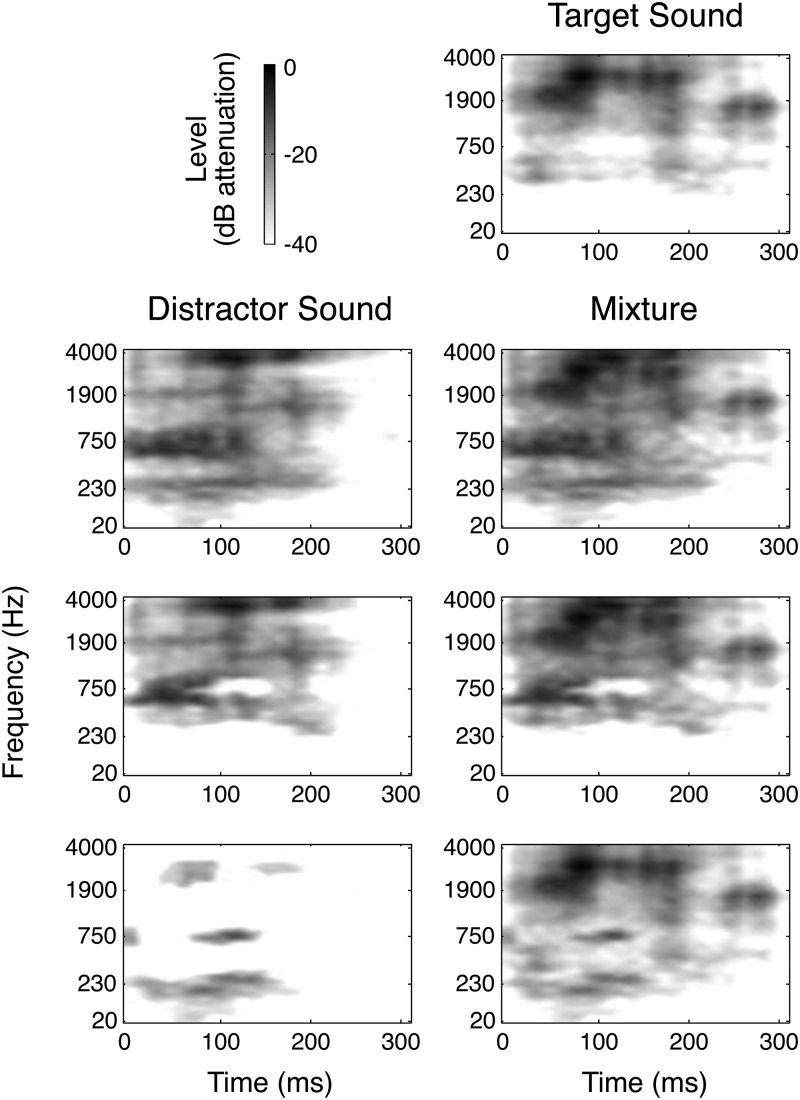
Figure 3.
Spectrograms of example stimuli from experiment 2. A target sound is shown at the top. The bottom three rows show the three distractor types (normal, max overlap and min overlap) for that target sound, created by masking the normal distractor (see experiment 2: Methods). To the right of each distractor is the spectrogram of the mixture of the target with that distractor. Aspect ratio and dB scale range differ from Fig. 1 to make the differences between distractor types easier to see.

