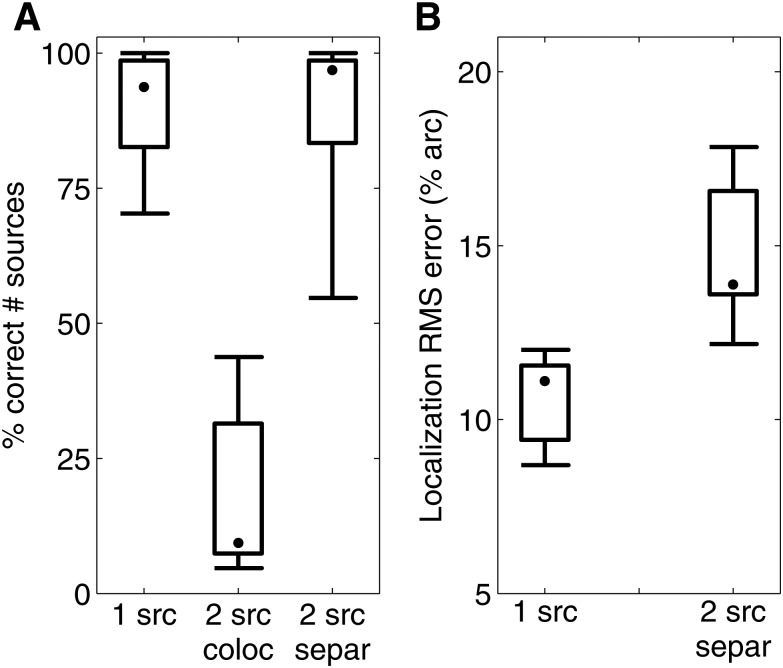
Figure 5.
Results of experiment 3, in which the task was to identify the location(s) of the one or two sound sources presented on a trial. (a) Box plots of the percentage of trials in which subjects correctly identified the number of stimuli contributing to the mixture. (b) Box plots of the mean RMS localization error for trials in which the subject correctly identified the number of stimuli in the mixture. The two-source-colocated condition is omitted as there were few trials in which the subject correctly identified the number of stimuli. Box plots show median (dot), the middle 75th percentile (5 of 7 subjects; boxes), and full range (whiskers).

