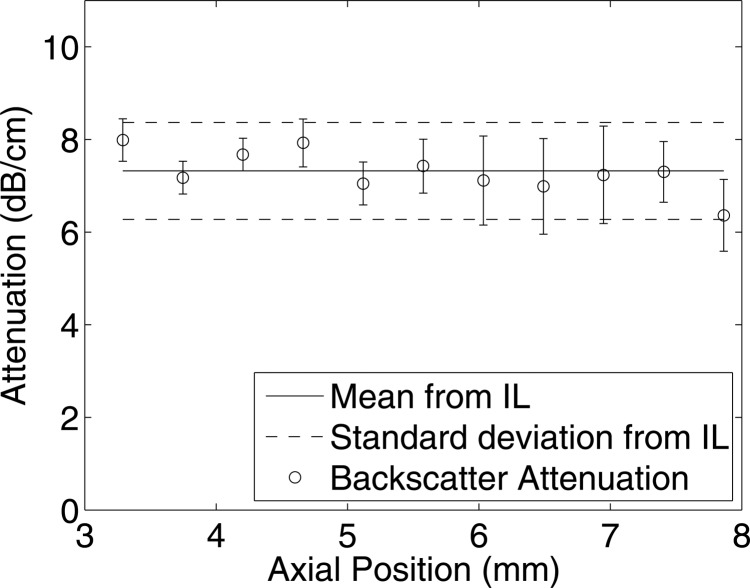
Figure 12.
Comparison of attenuation estimated using the insertion loss (IL) method with the proposed technique from rabbit liver RL 2 using transducer f/3–11 MHz. The horizontal axis denotes the attenuation estimated from different depths using the new method, and the standard deviation is obtained from all the data blocks at the respective depth.

