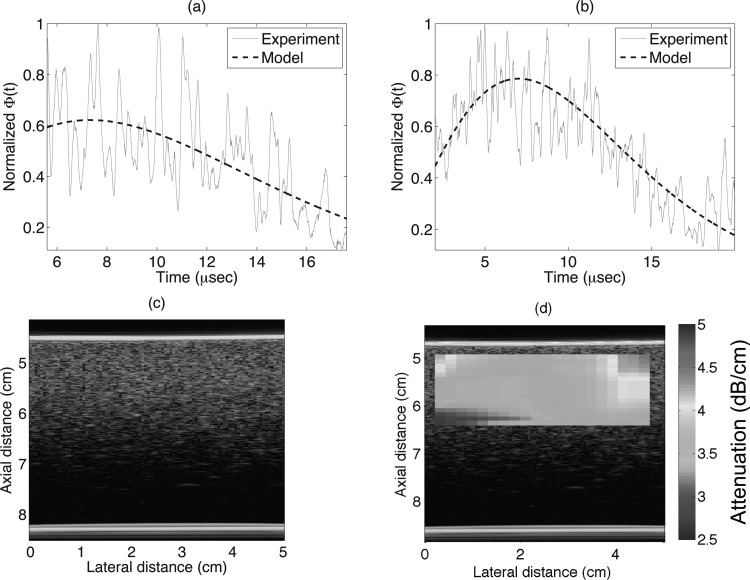
Figure 6.
(Color online) (a) Example variance of the signal and the model fit for a single data block of axial and lateral lengths of 20 PL and 20 BW, respectively. (b) Example variance of the signal and the model fit for a single data block of axial and lateral lengths of 25 PL and 50 BW respectively. (c) B-mode image, and (d) parametric B-mode image enhanced by attenuation maps for Phantom B.

