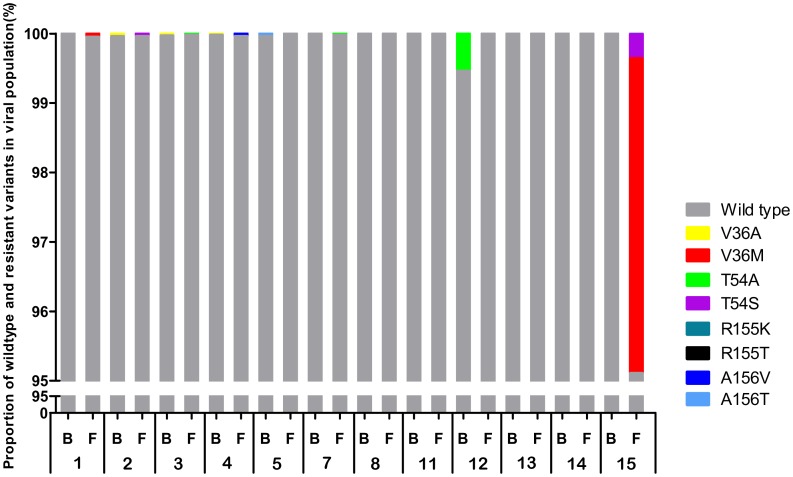
Figure 2. Prevalence of TVR resistance mutations at baseline and long-term follow-up.
The percentage of resistant variants in the viral population at baseline (B) and at long-term follow-up time point (F) is depicted for each patient. For display purposes, only the segment from 95–100% is displayed; the portion of the viral population from 0–95% for all patients is WT. For comparison, viral population composition at the EOT time point is provided in Table 1. Note that amplification of amplicon NS3-I for UDPS failed for patients 9 and 10 (B, F). Furthermore UDPS of both fragments (NS3-I, NS3-II) failed for patient 6 (B, F).

