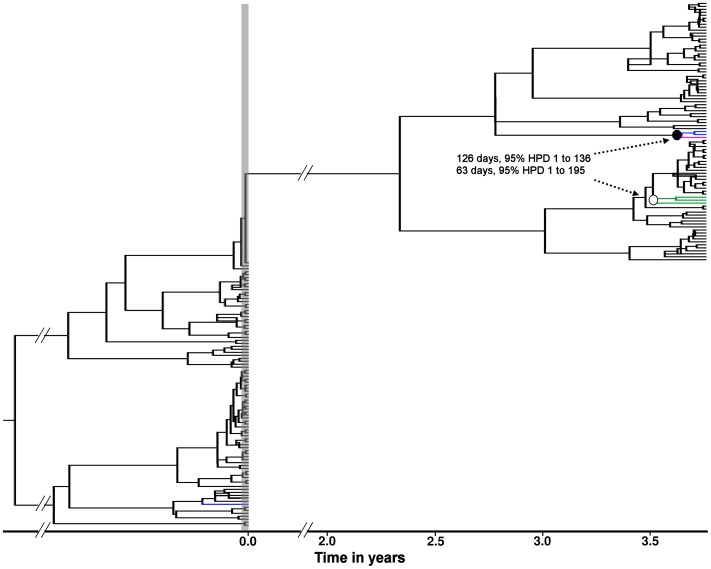
Figure 5. Molecular clock phylogeny from patient 15.
The tree represents the maximum clade credibility tree from the Bayesian MCMC analysis. The bullets at the nodes indicate the tMRCA estimates for the V36M (• = 126 days, 95% HPD 1 - 360) and T54A/S (○ = 63 days, 95% HPD 1 - 195) resistant variants. The V36M, T54A and T54S mutations are indicated in green, blue and pink respectively. The vertical grey shaded bar indicates the TVR-treatment period. Time scale in years relative to the EOT period is indicated on the X-axis.

