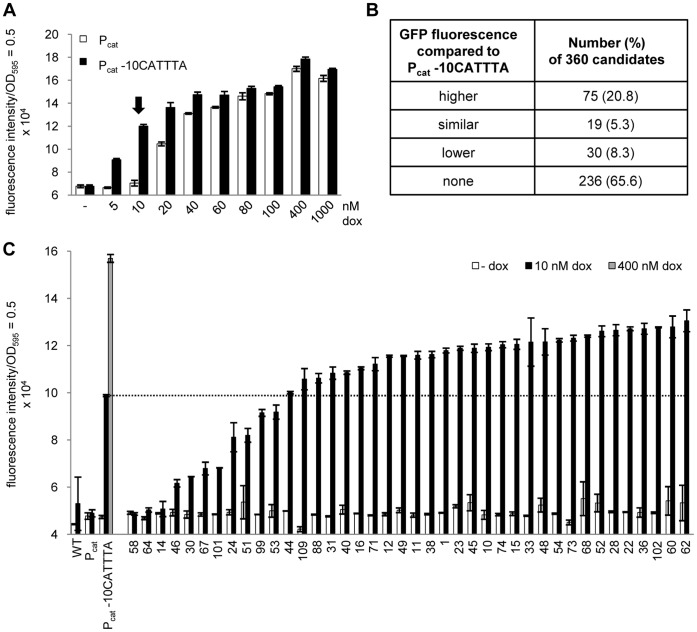
Figure 3. A synthetic promoter library generated by random mutagenesis of the Pcat -10 element yields candidates with different induction efficiency.
(A) Dose-response curve of Pcat and Pcat -10CATTTA strains to identify the dox concentration for screening (indicated by an arrow). Both strains were incubated with increasing amounts of dox, and their respective GFP fluorescence was determined in a microplate reader. (B) Classification of the 360 library candidates according to their GFP fluorescence with respect to the reference strain carrying Pcat -10CATTTA. Total numbers are listed and percentages are given in brackets. (C) GFP fluorescence measurement of 40 promoter library candidates, ordered by increasing fluorescence. Controls were Salmonella WT and the strains containing PtetA gfp+ either with Pcat tetR or with Pcat -10CATTTA tetR. Candidates and controls were incubated without and with 10 nM dox. For maximum induction of TetR, the Pcat -10CATTTA strain was incubated with 400 nM dox. The dashed line allows a direct comparison with the induction level of the Pcat -10CATTTA strain at 10 nM dox. Bars in (A) and (C) represent the fluorescence intensity which was normalized to a 1 ml culture with OD595 = 0.5. The data are a representative set from at least three independent measurements and display the mean ± standard deviation.

