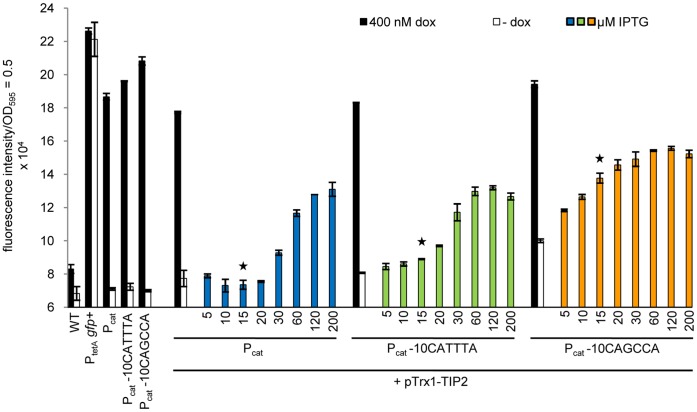
Figure 6. Dose-response curve of TetR induction by a plasmid-borne Trx1-TIP2 fusion protein in the strains with promoters Pcat, Pcat -10CATTTA or Pcat -10CAGCCA expressing TetR.
The promoter variants were incubated without and with 400 nM dox for maximum induction of TetR or with increasing IPTG concentrations for plasmid-encoded Trx1-TIP2 (pTrx1-TIP2) expression. The Salmonella WT strain, the reporter strain lacking TetR (PtetA gfp+) and the promoter mutants without the plasmid served as controls and were incubated without and with 400 nM dox. The star marks the IPTG concentration at which the level of Trx1-TIP2 corresponds roughly to the endogenous Trx1 level. The bars represent the fluorescence intensity which was normalized to a 1 ml culture with OD595 = 0.5. The data are a representative set from at least three independent measurements and display the mean ± standard deviation.

