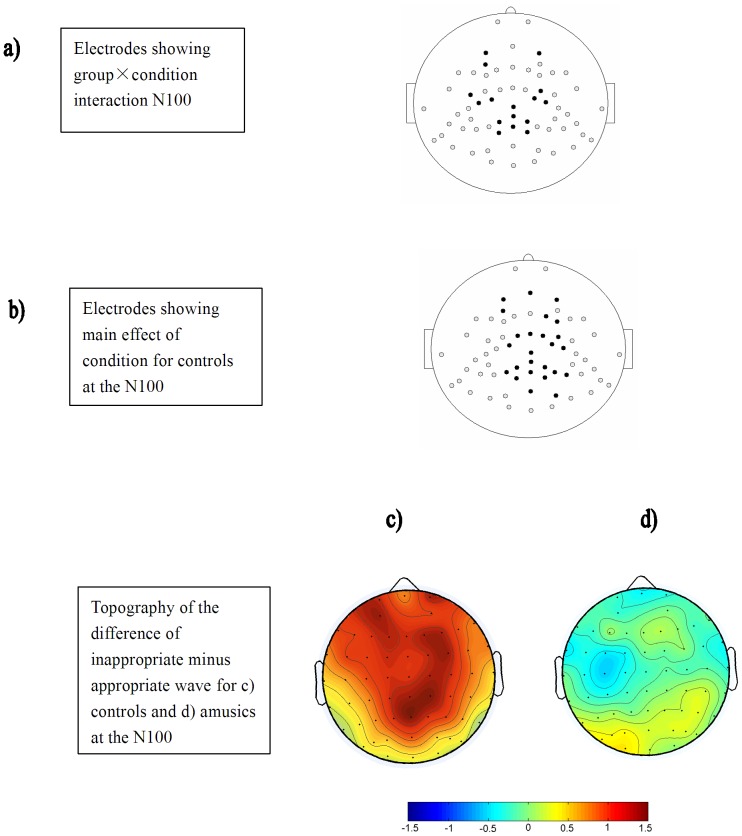
Figure 3. Locations of electrodes (solid black) that show a significant condition by group interaction (top row) and the effect of condition between the appropriate and inappropriate conditions for the control group (middle row) over the100–150 ms time window.
The bottom row shows the voltage topography of the N100 effect for the control and amusic groups.

