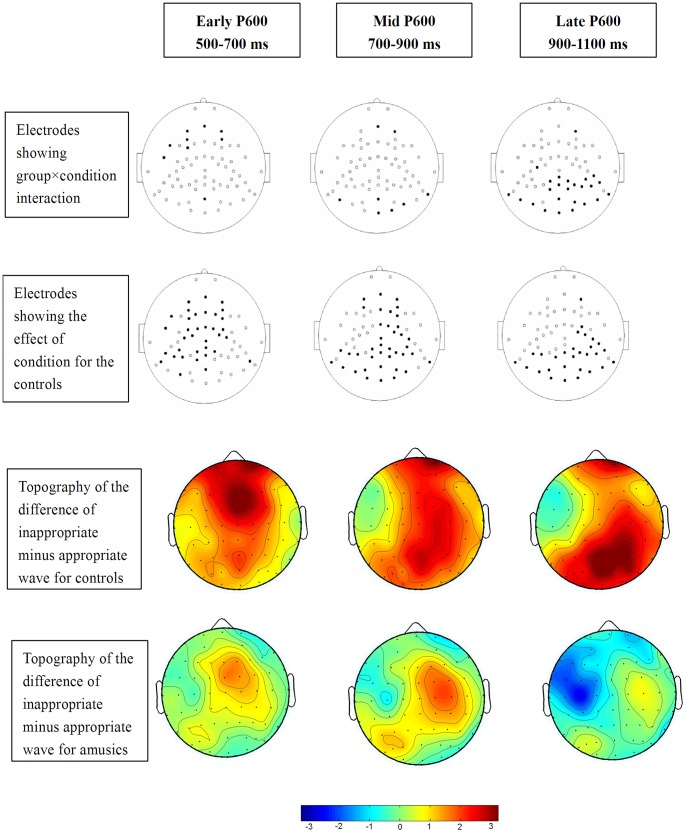
Figure 5. Locations of electrodes (solid black) that show a significant condition by group interaction (top row) and the effect of condition between the appropriate and inappropriate conditions for the control group (middle row) over the early (500–700 ms), mid (700–900 ms), and late (900–1100 ms) P600 time frame.
The bottom row shows the voltage topography of the difference of inappropriate minus appropriate wave over the respective time windows for the control and amusic groups.

