
Figure 1. The kinetics of amyloid fibrillation induced by dissolving insulin (0.6 mg/mL) in glycine buffer (20 mM, pH 2.0) and 37°C and agitation.
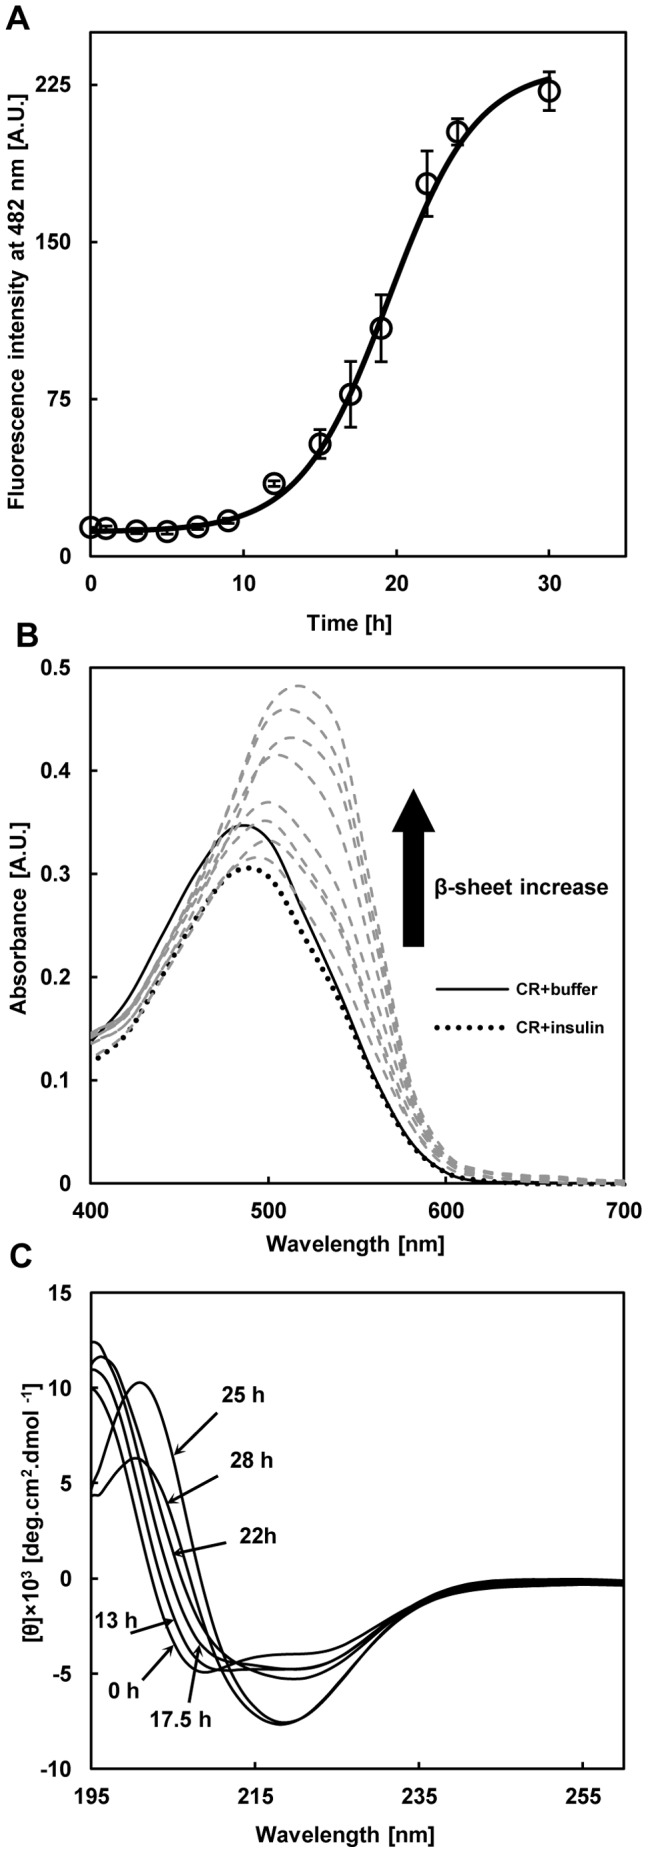
A) The content of fibril formation was recorded via ThT fluorescence as a function of incubation time. Data represent the average of 3 independent measurements and error bars represent standard deviation from the mean value. B) The content of fibril formation was also recorded via Congo red absorption spectrum during incubation time. Congo red spectrum alone (____) with native insulin (….) and with incubated samples (- - -) after 10, 13, 15, 18, 20, 23, 25 and 30 h, respectively. C) Far-UV CD spectra of bovine insulin during incubation time. At the onset of incubation (0h) two minima at 208 and 222 nm indicate α–helical structure. After 28 h of incubation, appearance of a new minimum at 216 nm indicates cross β–sheet structure because of amyloid fibrillation.