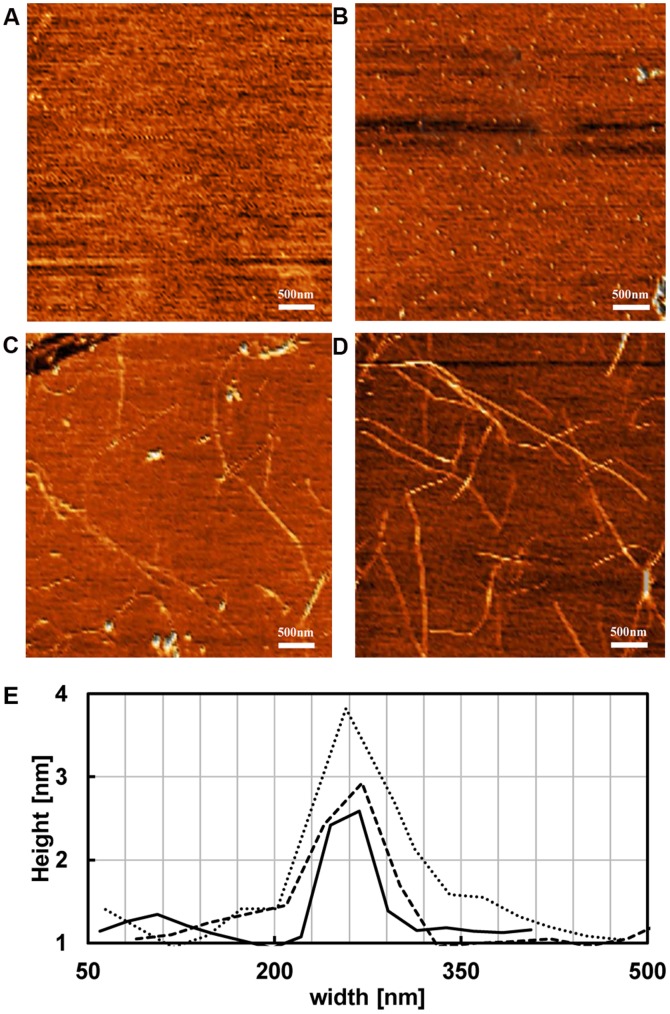
Figure 2. AFM images were recorded at different time points of insulin fibrillation as deducd from ThT fluorescence profile.
A) 0 h showing no remarkable structure for native insulin, B) 12 h, spherical shapes as oligomer structures, C) 22 h, single strand proto-fibrils, D) 30 h, long and mature fibrils with visible nodes because of twisted proto-fibrils. The scale bar represents 500 nm.

