
Figure 3. Surface tension changes for various forms of insulin showing the extent of surface tension of solutions containing insulin with native, oligomer intermediates, proto-fibril, and fibril structures at the air-water interface.
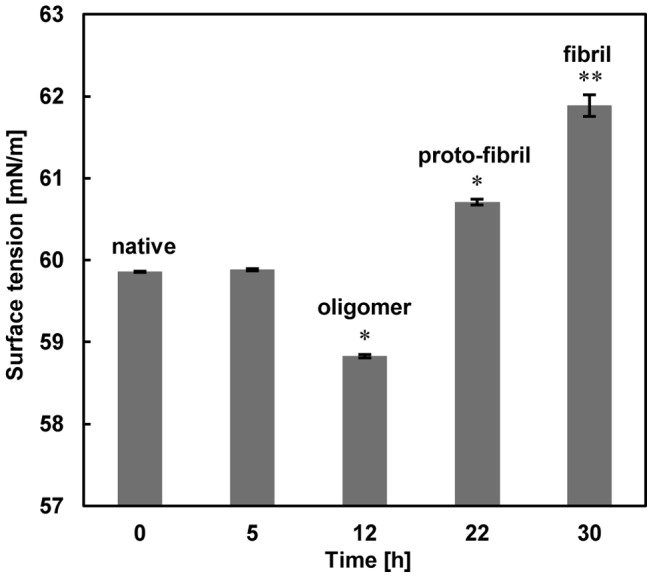
Data represent the average of decuple measurements and error bars represent standard deviation (SD). *Significantly different from native insulin. Statistical significances were achieved when p<0.05.