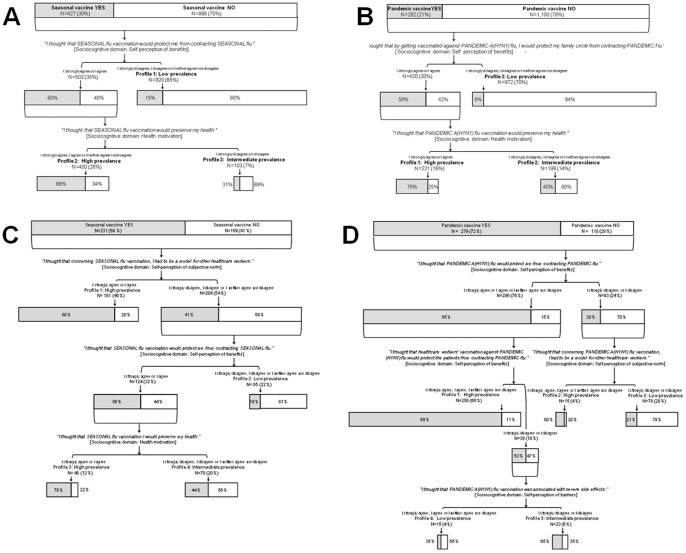
Figure 4. Classification-and-regression trees (CART) according to seasonal and pandemic A(H1N1) influenza vaccination status for paramedical and medical healthcare workers (HCW).
The overall areas of the rectangles indicate the proportional sizes of the subgroup relative to the root population of HCW. Shaded areas represent the percentages of HCW in each subgroup that were actually vaccinated. The entire population was divided into subgroups based on the statements (reported in italics) that best discriminated between vaccinated and nonvaccinated HCW. At the termination and for each analysis, HCW were subdivided into profiles with high, intermediate and low prevalences of vaccination. Panel A: Seasonal influenza vaccination of paramedical HCW (N = 1,423). Panel B: Pandemic influenza vaccination of paramedical healthcare workers (N = 1,392). Panel C: Seasonal influenza vaccination of medical healthcare workers (N = 390). Panel D: Pandemic influenza vaccination of medical healthcare workers (N = 389).

