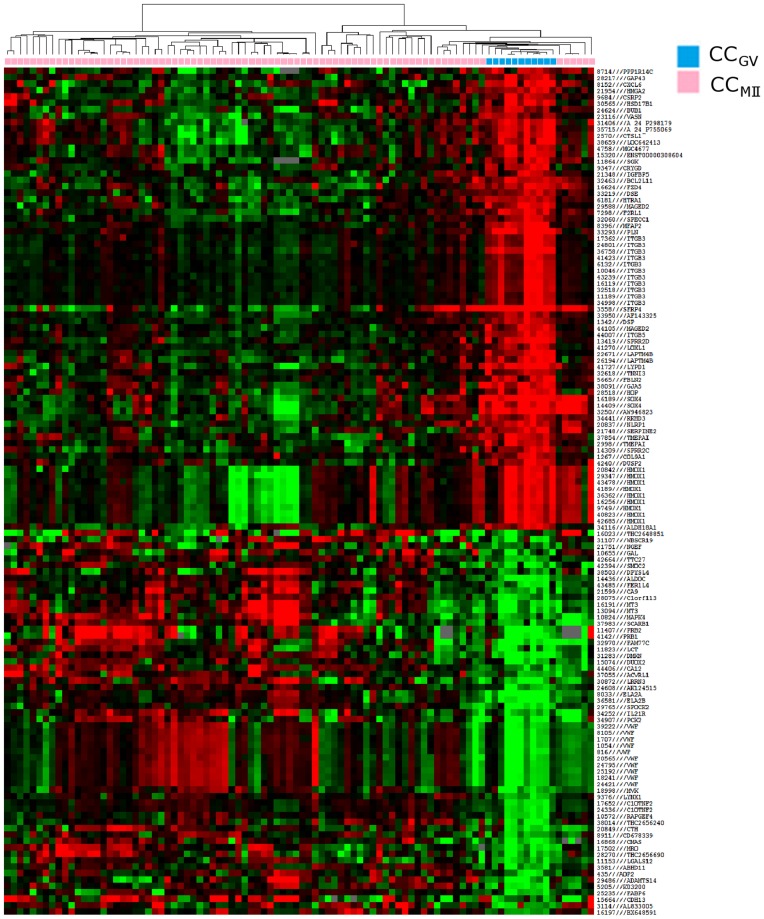
Figure 2. Heat map and cluster dendograms of gene clusters differentially expressed according to oocyte nuclear maturity.
Hierarchical clustering of cumulus cell samples (columns) and the 132 most significant probes (rows). Upregulated genes are marked in red, downregulated genes are marked in green. CCGV (blue), cumulus cells from immature oocyte at germinal vesicle stage; CCMII (pink), cumulus cells from mature oocyte.

