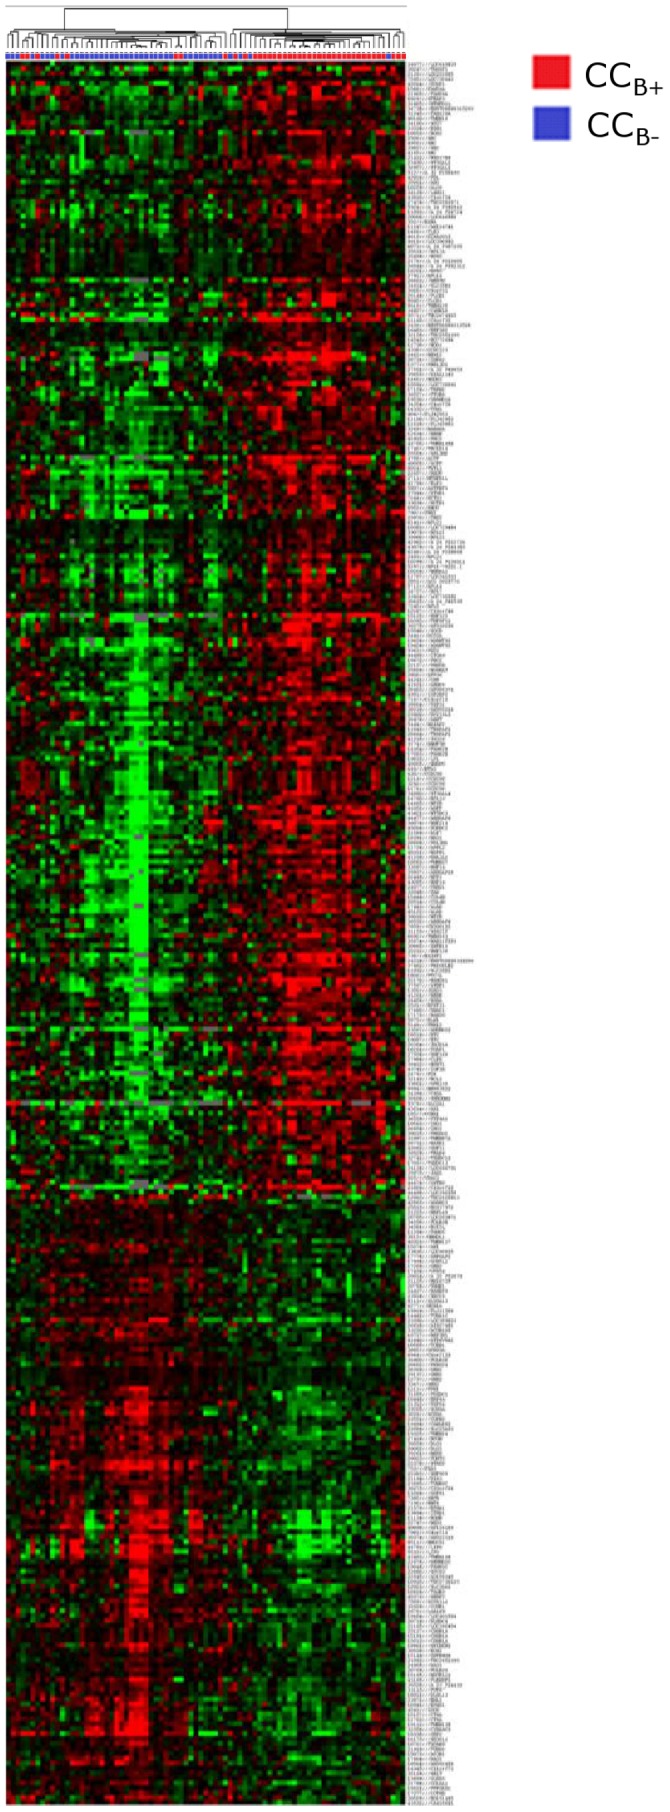
Figure 3. Heat map and cluster dendograms of gene clusters differentially expressed according to oocyte developmental competence.

Hierarchical clustering of cumulus cell samples (columns) and the 354 most significant probes (rows). Upregulated genes are marked in red, downregulated genes are marked in green. CCB- (blue), cumulus cells from mature oocyte which arrested at the embryo stage at day 5/6 of in vitro culture once fertilised; CCB+ (red), cumulus cells from mature oocyte yielding a blastocyst at day 5/6 of in vitro culture once fertilised.
