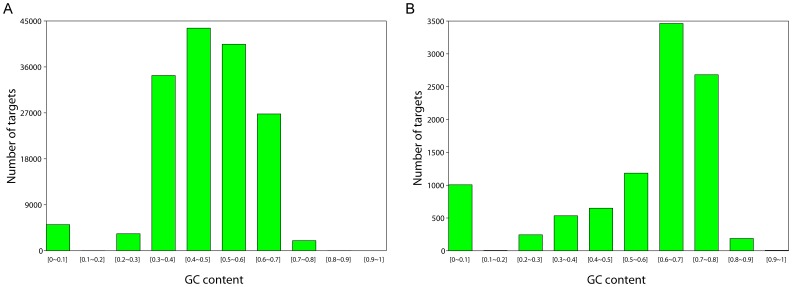
Figure 2. GC distribution of captured and un-captured targets by CE1.
Sequenced CE1 exome was compared with its closest reference genome (rheMac2) to examine the influence of GC content on coverage. (A) Captured targets were defined as targets with more than 50% of bases covered at least by one read. The captured targets were mainly of moderate GC content. (B) Uncaptured targets were less than a half of the bases coverd by at least one read. The uncaptured targets were dominated by high GC content, except for a small portion with low GC content.

