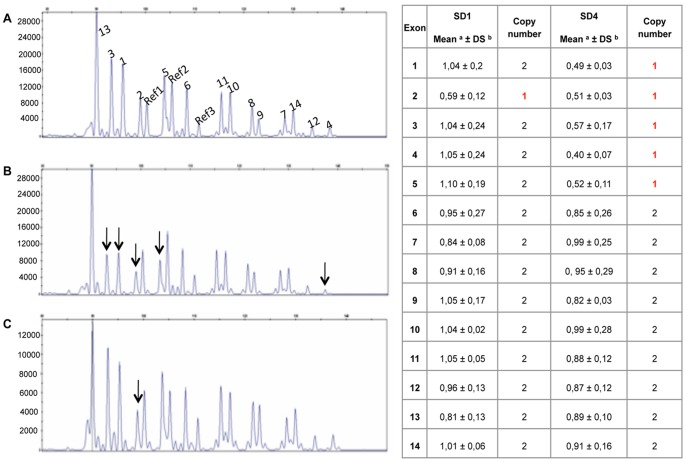
Figure 1. MLPA analysis of SD1 and SD4 patients.
Panels A–C: Capillary electrophoresis profile of the MLPA analysis performed in a normal control (panel A) and patients SD4 (panel B) and SD1 (panel C). Each peak corresponds to the amplification of a probe specific for each exon of HEXB gene (numbered 1 to 14) and for 3 different reference genes (R1, R2, R3). Arrows indicate the peaks corresponding to the HEXB exons deleted in SD1 and SD4 patients. Panel D) Relative quantification of HEXB copy number was obtained by dividing the height of each gene-specific peak by the sum of the heights of 3 reference gene peaks. This ratio was then compared to the average ratio obtained from 8 control samples having each 2 HEXB gene copies. A ratio between 0.75 and 1.25 corresponds to 2 HEXB copy number while a ratio between 0.25 and 0.75 corresponds to 1 HEXB copy number.

