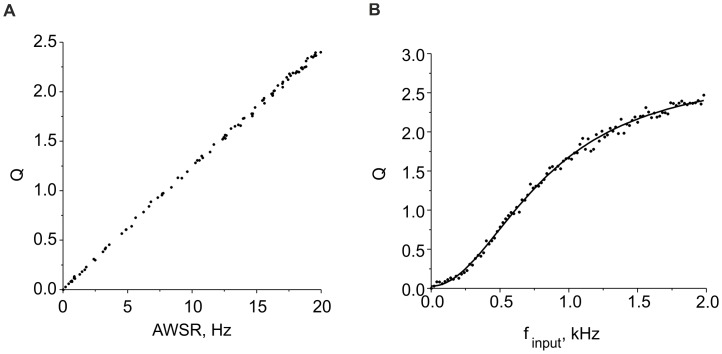
Figure 2. Characteristics of average activity.
A. Average activity values versus average spiking rate (AWSR) calculated in the model Eqs. (1)–(6) for different input frequencies over the time window T = 2 min. B. Average activity Q versus input frequency. The solid curve shows the logistic curve (Eq. (8)) fitting the data. Parameter values: Ith = 4.5 µA/cm2, b = 6, kq = 0.01, αq = 0.0001 mses−1, and βq = 0.01 msec−1.

