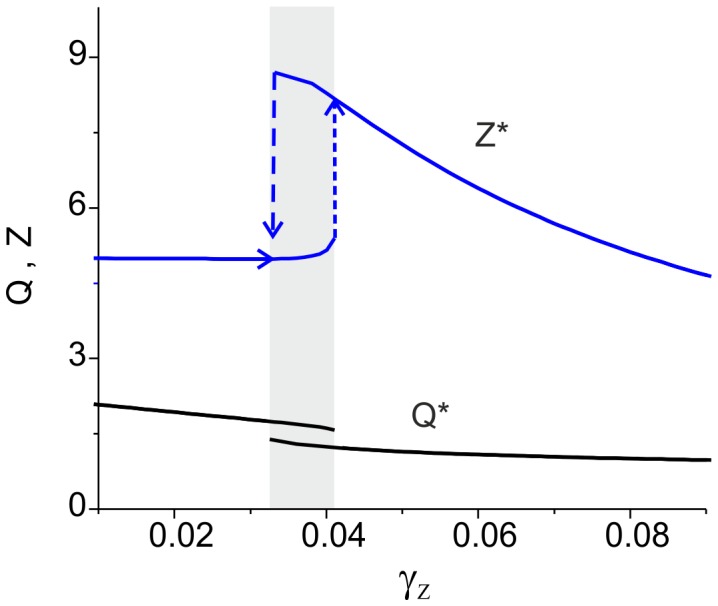
Figure 7. Dynamics of the ECM-protease regulation cascade depending on the feedback gain obtained in the simulation of Eqs. (9) and (14) for different initial conditions.

The gray area illustrates bistability. Parameter values: z0 = p0 = 0, z1 = p1 = 1, θz = 1,kz = 0.15, θp = 1.5,kp = 0.05, αz = 0.001 msec−1, βz = 0.01 msec−1, αp = 0.001 msec−1, βp = 0.01 msec−1, γP = 0.1, α1 = 0.0001 msec−1, α2 = 0.001 msec−1, I0 = 4.5, b0 = 6, Q0 = 2.23, and kI = 0.6625.
