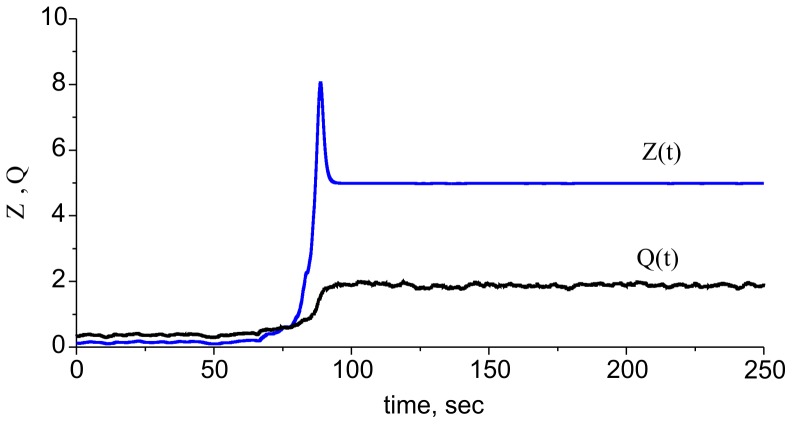
Figure 11. Dynamics of the ECM receptor regulation cascade in the spiking model (1)–(6), (9), and (10).
Due to the integration of the Poisson input train, the Q variable begins fluctuating near the Q∞ value (see Eq. (7) in Methods). This figure illustrates a spontaneous transition from the lower to higher level state. Parameter values: z0 = p0 = 0, z1 = p1 = 1, θz = 1,kz = 0.15, θp = 1.5,kp = 0.05, kq = 0.01, γp = 0.1, Io = 4.5 µA/cm2, b0 = 6.5, γZ = 0.0, γZR = 0.065, αq = 0.0001 msec−1, βq = 0.01 msec−1, αz = 0.001 msec−1, βz = 0.01 msec−1, αp = 0.001 msec−1, βp = 0.01 msec−1 and finput = 0.2 kHz.

