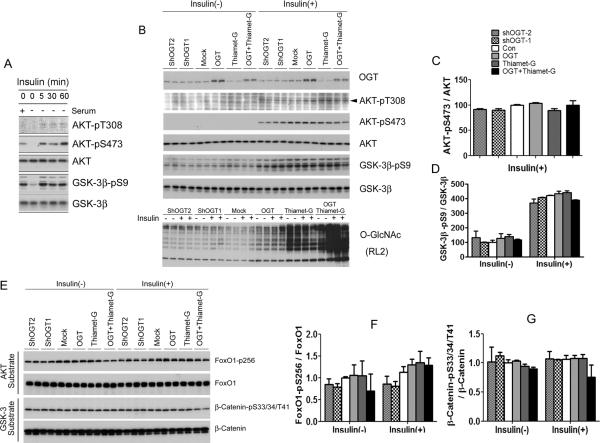
Fig. 4.
Phosphorylation and activity of AKT and GSK-3β after alterations of OGlcNAcylation in HepG2 cells. (A) HepG2 cells were treated with 100 nM insulin for 0, 5, 30 or 60 min, and the levels of AKT and GSK-3β and their phosphorylation were determined by Western blots. (B) HepG2 cells cultured in serum-free medium for 12 hr were transfected with OGT or shOGT for 36 hr, followed by treatment with 25 μM thiamet-G for 12 hr. Then some cells were also treated with 100 nM insulin for 30 min. The levels of OGT, O-GlcNAc, AKT, and GSK-3β as well as their phosphorylation were determined by Western blots. (C,D) Densitometric quantifications of AKT-pS473 and GSK-3β-pS9 after normalization by the kinase levels (from ATK and GSK-3β blots, respectively). AKT-pT308 was not quantified because of the weak immuno signals with high backgrounds. (E) The levels of AKT substrate FoxO1 and GSK-3β substrate β-catenin and their phosphorylation were determined by Western blots. (F,G) Densitometric quantifications of FoxO1-pS256 and β-CateninpS33/37/T41 after normalization by the total protein levels. Data are presented as mean ± SD. * p<0.05 vs. the mock transfection control group.

