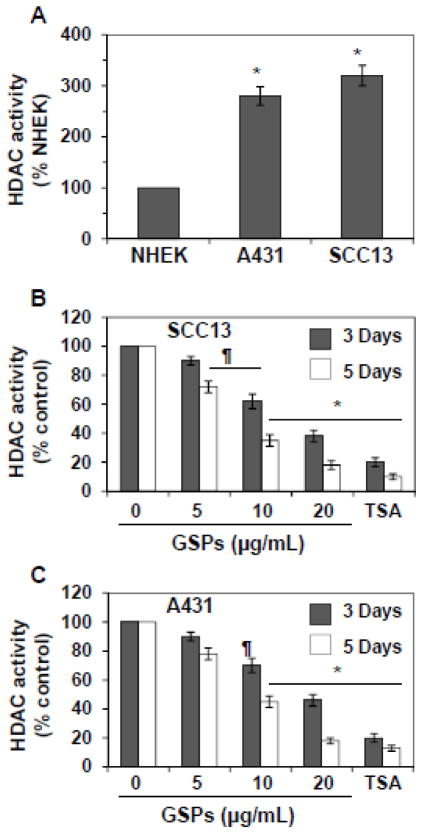
Figure 4.
Effect of GSPs and TSA on HDAC activity in A431 and SCC13 cells. (A) Comparative levels of HDAC activity in NHEK, A431 and SCC13 cells. Data are presented in terms of percent of NHEK, which were used as a normal control cells. Significant greater HDAC activity versus NHEK, *P<0.001. (B & C) SCC13 and A431 cells were treated with various concentrations of GSPs (0, 5, 10 and 20 μg/ml) for 3 or 5 days, and HDAC activity was assessed with proteins of nuclear extracts prepared from various treatment groups using HDAC Activity Assay Kit following the manufacturer’s instructions. Cells were also treated with TSA (0.2 μM) for 3 and 5 days and was used as a positive control. Data are presented as mean ± SD (n=3) and presented in terms of percentage versus non-GSPs-treated controls. Significant difference versus controls; **P<0.05, *P<0.001.

