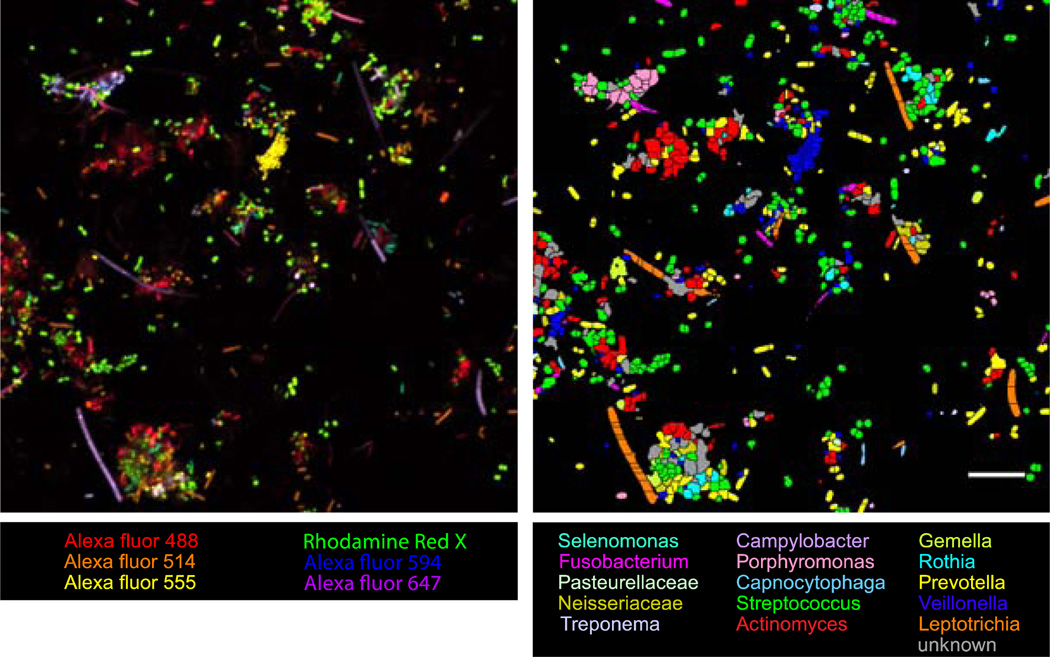
Figure 3. Example CLASI-FISH image.
Images of CLASI-FISH-labeled semi-dispersed human dental plaque. Colors in the raw spectral image (Left) represent one of six different fluorophores, used in all the possible binary combinations to label 15 different taxa in the community. Color in the segmented image (Right) of the same field of view represents one of each of the 15 probed taxa. Cells, which are ambiguous in their label type because of errors in image segmentation, are declared unknown and colored grey. Bar = 10 µm.

