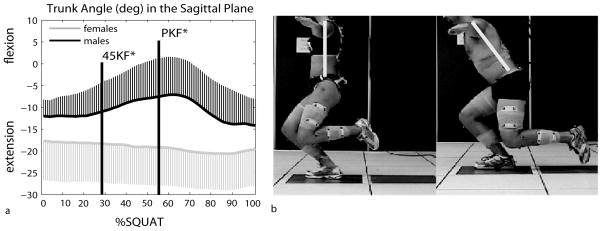
Figure 2.
(a) Time series curves of the trunk angle in the sagittal plane normalized as % squat cycle and averaged across subjects for each gender. 45KF and PKF represent the time points where 45 knee flexion and peak knee flexion occurred. Thick lines represent the means. Error bars represent the SD at each time point. Asterisks refer to significant differences (p<0.05). (b) Descent squat phase in one female and one male subject.

