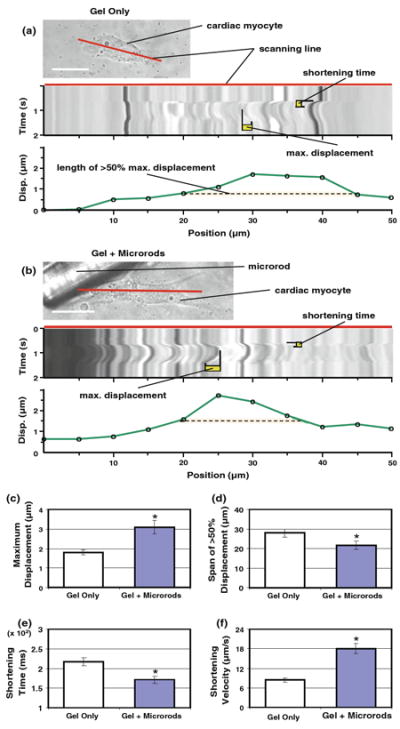
Fig. 3.

Axial mechanics of cardiac myocyte contraction are influenced by microrod presence. a, b Rapid traces along the long axis of single myocytes with or without local microrods (scale 20 μm) were captured as a one-dimensional time series (or a line scan, with placement designated by red line). From each scaled line scan, offline measurements of shortening time and maximum displacement could be made for individual myocyte beats. Cell displacement was also measured at 5 – μm intervals (green line in plot) along the span of each line scan, which was used to determine the axial span (dashed orange line) of the greatest displacements (>50% of maximum). c Myocytes abutting a microrod exhibit significantly higher maximum displacements (3.08 ± 0.34 μm) than cells in gels with no microrods (1.79 ± 0.12 μm) (n = 26 scans total). d The axial span of the greatest displacements is smaller in myocytes with adjacent microrods (21.73 ± 2.16 μm) than in control cells (27.98 ± 2.08 μm). e Microrod inclusion causes a decrease in the shortening time of myocytes (from 217.4 ± 10.1 to 171.2 ± 9.1 ms). f A simple index of shortening velocity (maximum displacement/shortening time) is found to be significantly higher in microrod groups (18.02 ± 1.59 μm/s) compared to control cells (8.42 ± 0.70 μm/s). Mean ± SEM. * p < 0.05
