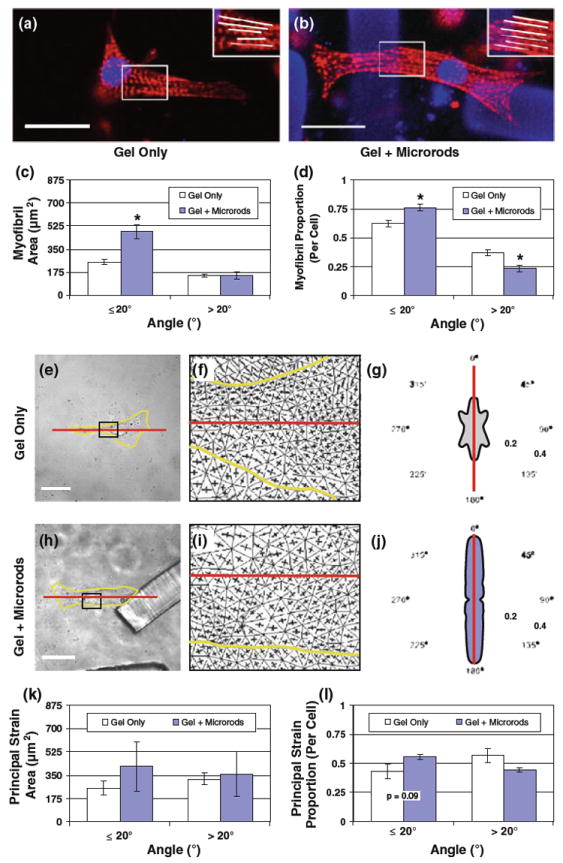
Fig. 4.

Effect of microrods on myofibril orientation and axial alignment of principal strain in cardiac myocytes. a, b Myocytes with or without microrods in 3D gels were fixed and stained for actin (rhodamine phalloidin, red) and nuclei (DAPI, blue). Note that microrods also appear blue (scale 20 μm). Myofibrils and their predominantly longitudinal orientation can be distinguished in the inset zooms. c Images from fluorescent staining were analyzed to survey the orientation of myofibrils within regular 2.5–μm square regions. The total area of myofibril angles equal or less than 20° (deviation relative to myocyte long axis) is significantly higher in cells with microrods (483.3 ± 50.8 μm2) than in control cells (253.3 ± 18.9 μm2), but no difference exists between the area of unaligned myofibrils greater than 20° (n = 15 cells per group). d The proportion of aligned (≤ 20°) myofibril area in cells is significantly higher in the presence of microrods (0.77 ± 0.03) compared to cells with no microrods (0.63 ± 0.03); the reverse is true for the proportion of unaligned (> 20°) myofibril area. e, h Images of single myocytes (yellow outline) in gel alone or with microrods were correlated from states of rest and peak contraction (scale = 20 μm). f, i Strain data were collected for images sets of each condition and used to calculate the maximum and minimum principal strain vectors (represented as orthogonal lines) that occur at points within the captured field. The areas shown are zooms of the insets shown in e and h. The long axis of each cell is also marked (red line). g, j The fraction (normalized by cell area) of maximum principal strains by angle (relative to the assigned long axis, red line) is displayed within polar plots of each example. k All principal strain data averaged across multiple cells (n = 5) yield no statistical significance, but did show trends that supported the more extensive myofibril analysis. Accordingly, the average area of maximum principal strain is identified at angles near the myocyte long axis (≤ 20°) in conditions with or without microrods. l Directions of principal strain are aligned with the long axis in slightly greater cellular proportions when microrods are present (0.56 ± 0.02 vs. 0.43±0.06), but these differences are not significant. Mean ± SEM. * p < 0.05
