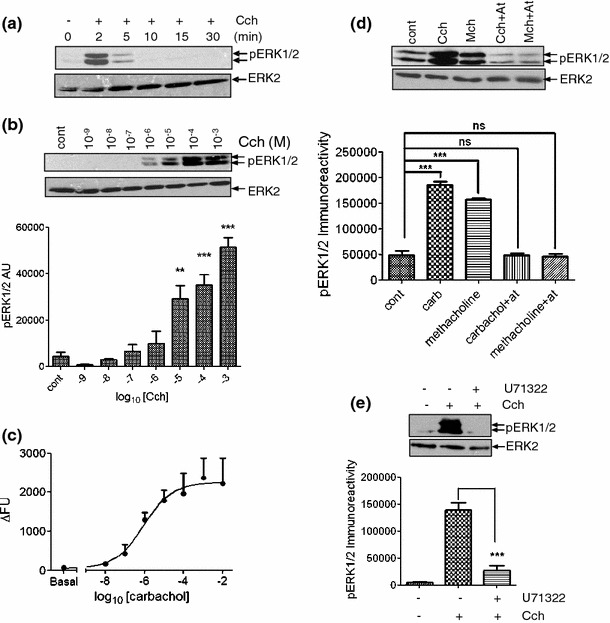
Fig. 1.

Characterization of carbachol-stimulated increase in [Ca2+]i and ERK1/2 activation. MIN6 cells pre-incubated for 1 h with KRB-minus-glucose; a Carbachol (1 mM) for the times indicated; b carbachol at the concentrations indicated for 2 min. Proteins were separated by SDS–PAGE and detected by Western blotting using anti-phospho-ERK1/2 and anti-ERK2 antibodies. Data shown in lower panel are means + SEM (n = 3). **P < 0.01, ***P < 0.001; one-way ANOVA followed by Dunnett’s range test comparing to no carbachol addition. c Concentration–response curve for carbachol-stimulated increases in [Ca2+]i determined in cell populations using a NOVOstar plate reader. Data represent means SEM (n = 3) of the peak change in fluorescence (∆FU) correlating with peak increases in [Ca2+]i. d Where indicated, cells were incubated with atropine (At, 10 μM) for 30 min prior to treatment with carbachol (Cch, 1 mM) or methacholine (Mch, 1 mM) for 2 min. Proteins were separated by SDS–PAGE and detected by Western blotting using anti-phospho-ERK1/2 and anti-ERK2 antibodies. Data shown in lower panel are means SEM (n = 3); ns no significance, ***P < 0.001 by Dunnett’s range test following one-way ANOVA comparing to no carbachol addition. e MIN6 cells were pre-treated with U73122 (1 μM) for 30 min prior to treatment with carbachol (1 mM, 2 min). Proteins were separated by SDS–PAGE and detected by Western blotting using anti-phospho-ERK1/2 and anti-ERK2 antibodies. Lower panel are means SEM (n = 3). Data were analyzed by a Student’s 2-tailed t test; ***P < 0.001. All immunoblots shown are representative of three independent experiments
