
Figure 1.
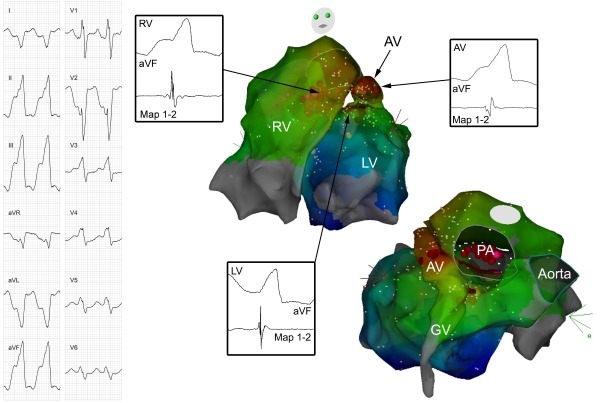
On the left side, the 12-lead ECG of the ventricular tachycardia is shown. On the right side, two views of an activation map of the VT are presented. Activation during VT in both ventricles as well as in the great cardiac vein (GV) and anterior cardiac vein (AV) is demonstrated. Recordings of distal ablation catheter (Map 1-2) and lead aVF at the earliest activation sites in the left ventricle (LV; 10 ms before QRS onset), in the right ventricle (RV, -20 ms) and in the AV (-20 ms) are shown. Brown dots represent ablation points, pink dots ablation points partially effective at higher power ablation. PA=pulmonary artery.