
Figure 1. MLPA reveals deletions in the final exon of SPAST.
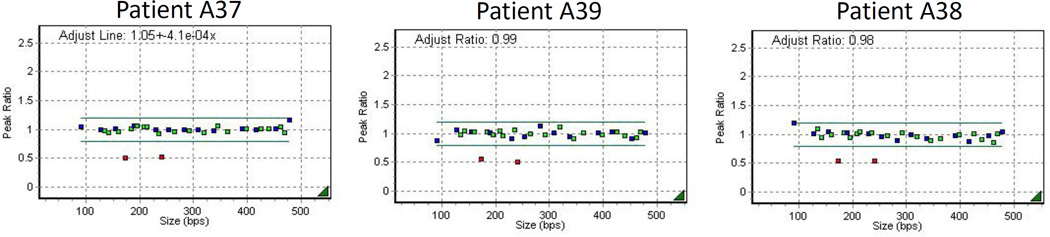
Dot plots depicting normalized MLPA values demonstrate that the genomic regions corresponding to two probe pairs – both localized to exon 17 of SPAST – are present in only a single copy in the three patients. This indicates a heterozygous genomic loss in exon 17 (the final exon) of SPAST. Green dots indicate probe pairs directed against exons of SPAST, blue dots indicate control probe pairs, and red dots indicate probe pairs in regions of copy number change.