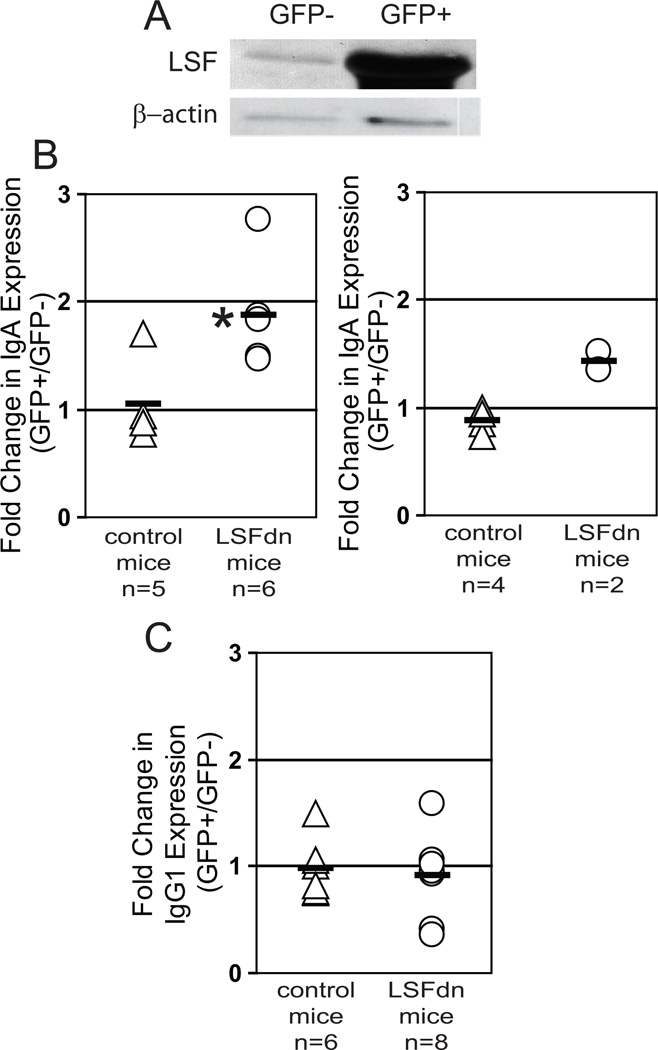
Figure 3.
LSFdn expression in B-cells increases switching to IgA, but not to IgG1, upon induction of CSR. A) Isolated B-cells (5 × 10⁶) from LSFdn chimeric mice were sorted into transduced (GFP+) and non-transduced (GFP−) populations based on GFP levels. Cell extracts from a single experiment were immunoblotted for LSF/LSFdn, using the LSF antipeptide antibody (Fig. 1), and for β-actin. B) Efficiency of IgM to IgA switching was determined for splenic B cells isolated from two groups of mice. Control mice (each indicated by a triangle) received bone marrow transduced with parental MSCV retrovirus. LSFdn mice (each indicated by a circle) received bone marrow transduced with MSCV-LSFdn retrovirus. Following stimulation in culture, splenic B cells were simultaneously analyzed for GFP and surface IgA expression. GFP expression levels separated transduced versus nontransduced populations. The fold change in IgA expression upon LSFdn expression, calculated as the ratio of the percentages of transduced cells vs. nontransduced cells that are IgA-positive, is plotted on the y-axis. Left panel: Cells were stimulated with LPS, IL-5, and TGF-β1 (control: n = 5; LSFdn: n = 6). Means (horizontal lines) and SEM were: 1.05 ± 0.17 for control mice, 1.88 ± 0.19 for LSFdn mice. *p=0.0048 (Student’s t-test). Right panel: Cells were stimulated with LPS and IL-4 (control: n = 4; LSFdn: n = 2) Means (horizontal lines) and SEM were: 0.88 ± 0.06 for control mice, 1.43 ± 0.09 for LSFdn mice. The probability that the values in these two data sets would be ordered by chance in this manner is 0.067 (Mann-Whitney U test). C) Splenic B cells derived from control and LSFdn mice characterized in (B) were analyzed for isotype switching to IgG1. Cells were stimulated with LPS and IL-4 (control: n = 6; LSFdn: n = 8). Cells were analyzed for GFP and IgG1 expression, and the fold change in IgG1 expression upon LSFdn expression calculated analogously to above (B). The means and SEM for the ratio of percentage IgG1-positive transduced cells to percentage IgG1-positive non-transduced cells were: 0.98 ± 0.11 for control mice and 0.92 ± 0.14 for LSFdn mice. The difference in means is not statistically significant.

