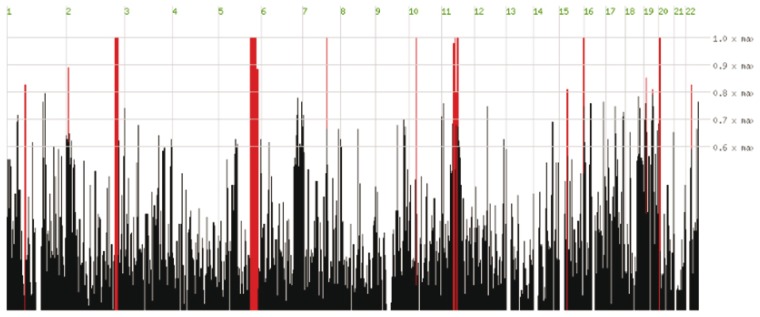
Figure 6.
Homozygosity mapping results derived from comparison of exome sequencing of two affected individuals in Family DMJD-1592. The ∼20 000 variants from each patient were plotted as a function of heterozygosity/homozygosity at each allele for each chromosome (x-axis). Red bars represent regions of homozygosity, which reach maximum significance (height of red bar) on chromosomes 2, 5, 7, 10, 11, 16 and 20.

