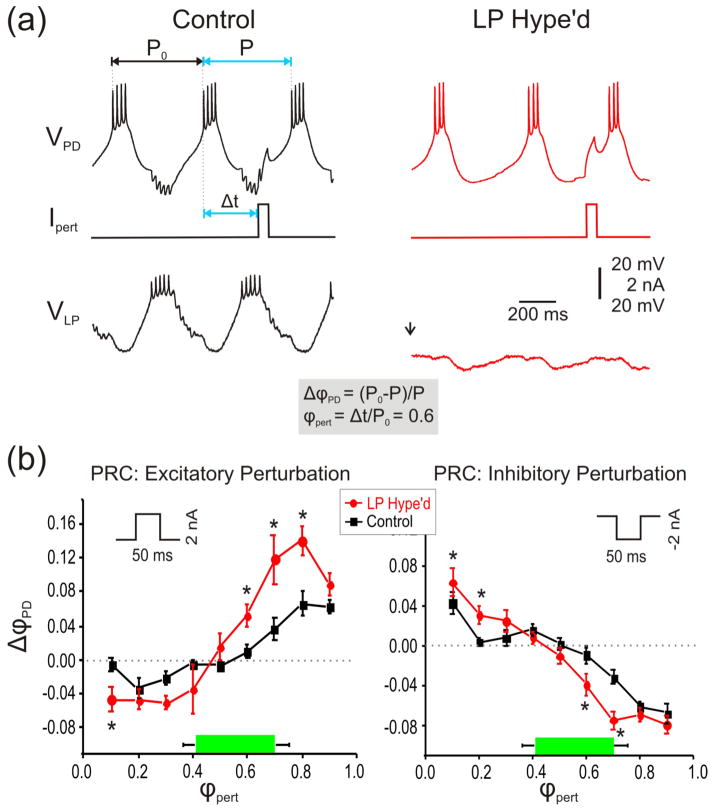
Figure 2.
The LP to PD synapse reduced the effect of artificial extrinsic perturbations. a. An example of the voltage trace of the PD neuron in response to an artificial perturbation (2 nA, 50 ms positive current pulse) at phase 0.6 when LP to PD synapse was intact (left) or when the LP neuron was functionally removed by injecting ~−5 nA current (right). The phase of the perturbation was calculated according to the previous cycle period (P0). Thus ϕpert = Δt/ P0=0.6 indicated that when the perturbation phase was set at 0.6, the perturbation current was injected at Δt (=0.6 P0) after the first action potential of the PD neuron (long vertical dotted line). b. A current pulse of amplitude 2 nA and duration 50 ms was used as the excitatory perturbation (left panel). The green bar indicates the LP burst phase. Without the LP to PD synapse (LP Hype’d), the PRC (ΔϕPD = ((P0 – P) / P0)) was more negative at early ϕpert values and more positive at late ϕpert values compared to Control two-way RM-ANOVA, p<0.05; N=10; *’s indicate points of significant difference from post-hoc analysis using Tukey’s test). Similarly, with an inhibitory perturbation (−2 nA, 50 ms pulse; right panel), the PRC was closer to zero in Control compared to LP Hype’d (two-way RM-ANOVA, p<0.05; N=10; *’s indicate points of significant difference from post-hoc analysis using Tukey’s test).

