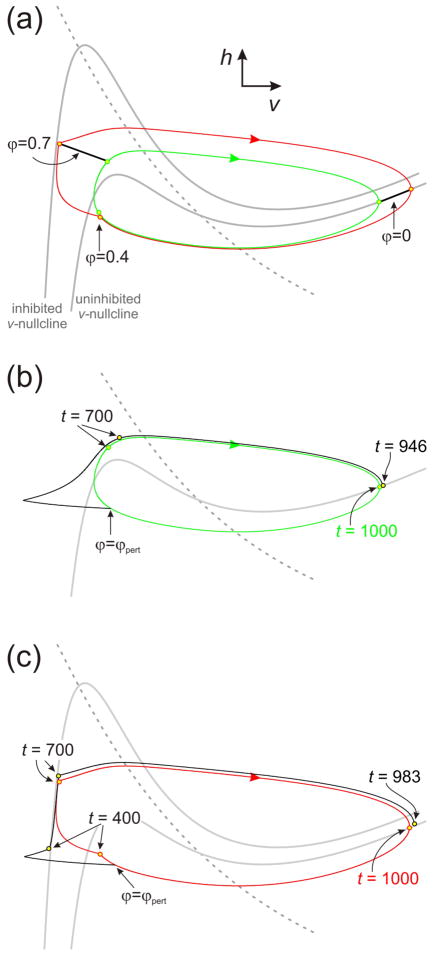
Figure 6.
Phase plane analysis of the effect of feedback inhibition on external perturbations. a. The uninhibited (green) and inhibited (red) trajectories evolving in the v-h phase plane. Specific points of equal phase are identified. The inhibited trajectory spends phases ϕ = 0.4 to 0.7 in a neighborhood of the inhibited v-nullcline. b. The effect of perturbing the uninhibited trajectory. A 20msec input of −0.125 nA is applied at ϕpert = 0.35 causing an advance in phase of the trajectory. Note that at t = 700 the perturbed trajectory leads the uninhibited one. This lead persists to the end of the cycle resulting in a shorter cycle period and a 0.054 advance in phase. c. The effect of perturbing the inhibited trajectory. The same perturbation as in (b) is applied. The perturbed trajectory is constrained to lie in a neighborhood of the inhibited trajectory until t = 700, resulting in a smaller decrease in cycle period and smaller increase of phase (0.017) compared to (b). Dashed gray curves: h-nullcline. Cubic gray curves: v-nullcline

