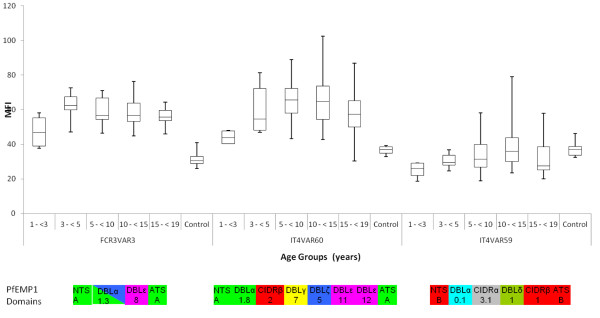
Figure 4.
Immune serum reactivity to three IT/FCR3Plasmodium falciparumparasite lines. The reactivity of 61 plasma samples from children living in malaria endemic Mgome, Tanzania, against three parasite lines expressing VAR3 (Group A PfEMP1), IT4var60 (Group A PfEMP1) and IT4var59 (Group B PfEMP1), respectively, was measured by flow cytometry and divided into age groups: [1- <3] n = 4; [3- <5] n = 6; [5- <10] n = 23; [10- <15] n = 19; [15- <19] n = 9. Danish controls n = 8. The PfEMP1 domain structures as previously described [23] are shown below each parasite seroprofile. Ends of whiskers in the boxplots represent the smallest and largest median of FITC fluorescence intensity (MFI) values in the given age group.

