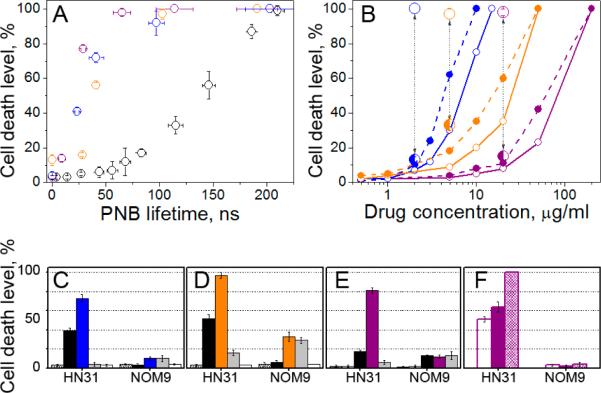
Figure 3.
Comparison of the efficacy and selectivity of PNBs and drugs (black: PNB alone, blue: Cisplatin, orange: Doxorubicin, purple: Doxil) shown through the levels of cell death (72 h) among cancer (HN31, hollow dots) and normal (NOM9, solid dots) cells in a co-culture as function of: A - maximal size of PNB (PNB lifetime), Cisplatin (2 μg ml−1), Doxorubicin (5 μg ml−1), Doxil (20 μg ml−1); B: drug concentration without PNBs (small dots) and with PNBs (large dots) in cancer/normal cells: Cisplatin (90±10/9±5 ns), Doxorubicin (90±10/9±5 ns), Doxil (65±8/11±4 ns); C-E: comparison of the different treatments (grey: drug alone, white: intact cells, dashed: NPs alone), C: Cisplatin, PNB lifetime in cancer/normal cells: 41±7 / 2±5 ns, D: Doxorubicin, PNB lifetime in cancer/normal cells: 90±10 / 9±5 ns, E: Doxil, PNB lifetime in cancer/normal cells: 28±5 / 1±1 ns; F: Doxil and single PNB (purple), Doxil being immediately removed after treatment with single PNB (white), 4 sequential PNBs (dashed).

