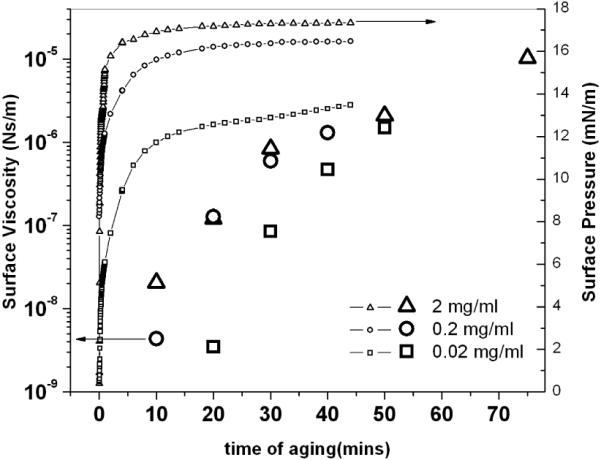
Figure 3.

Surface viscosity (large symbols) and surface pressure (small symbols) for 2, 0.2 and 0.02 mg/ml albumin concentrations as a function of time after mixing. The surface viscosity changes by orders of magnitude over hours, while the surface pressure reaches an equilibrium value within minutes.
