
Figure 4.
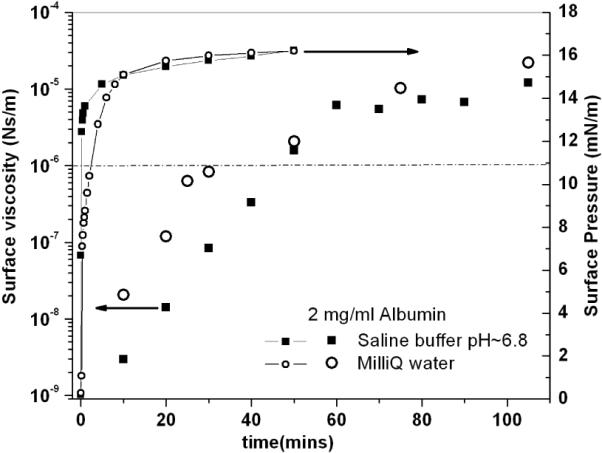
Surface viscosity (large symbols) and surface pressure (small symbol) vs. time of aging of the film for low (Milli-Q water) and high (saline buffer: 150 mM NaCl, 2 mM CaCl2, 0.2 mM NaHCO3, pH~7.0) salt concentrations, for a bulk protein concentration of 2 mg/ml. The dashed line indicates the maximum surface viscosity that can be measured with passive microrheology assuming a measurement time of 103 seconds.