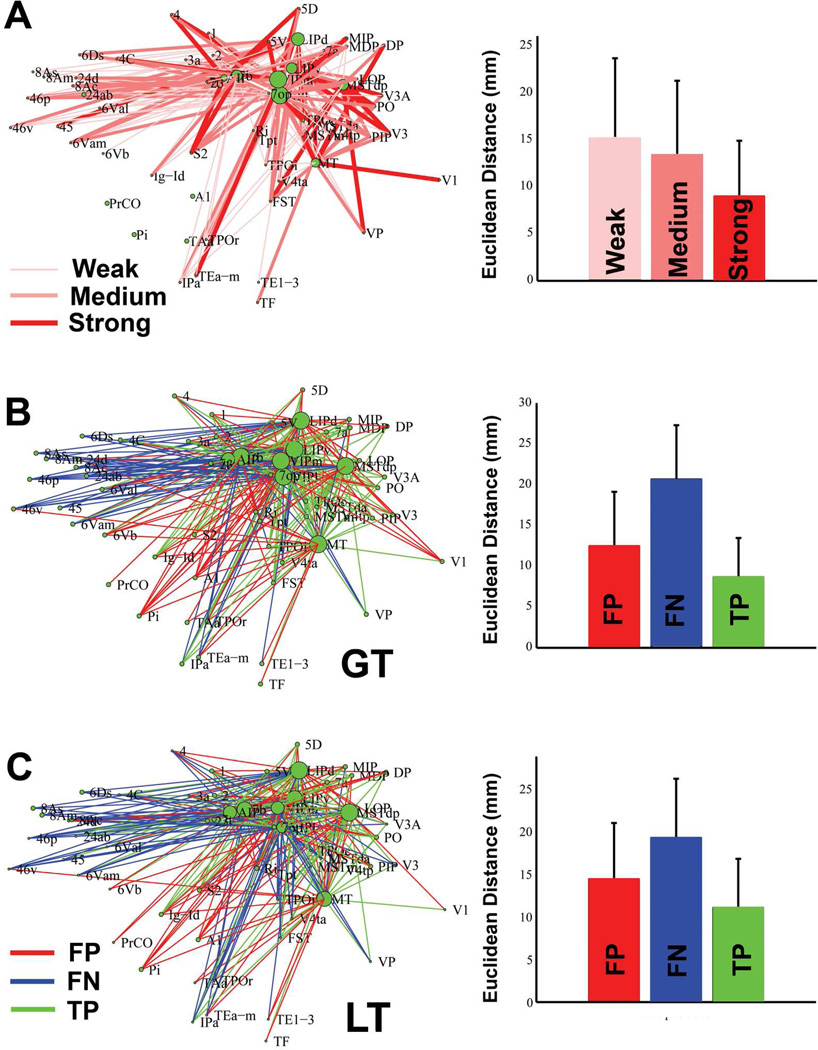
Figure 6.
The connections determined by tracer and diffusion tractography methods, and their relationship to connection distance. (A): The interregional connections derived using the tracer study (Lewis and Van Essen, 2000), which focused on the parietal and temporal regions. Different line widths and shades of red represent connections with different strength. The mean and standard deviation of the Euclidean distance between the weak, medium and strong connections are plotted on the right. ANOVA analysis indicates that there was a significant difference among the mean of the three groups, with the strong connection group having significantly shorter mean distance than the medium and weak groups (P<0.05, Tukey-Kramer correction). (B): The false positives (FP, red), false negatives (FN, blue) and true positives (TP, green) of the tractography-derived connections obtained using GT. The connections based on four hemispheres were averaged for the analyses. The mean and standard deviation of the Euclidean distance of the FP, FN, TP connections were plotted on the right. ANOVA analysis indicates a significant difference in the mean distance among the three groups (F(3,329)=71.7, p<1e-10), with the order TP< FP < FN (P<0.05, Tukey-Kramer correction). (C): Similar results were observed in the networks reconstructed using LT. ANOVA analysis indicates a significant difference in the mean distance among the three groups (F(3,319)=105, p<1e-10), with the order TP< FP < FN (P<0.05, Tukey-Kramer correction).

