Figure 4.
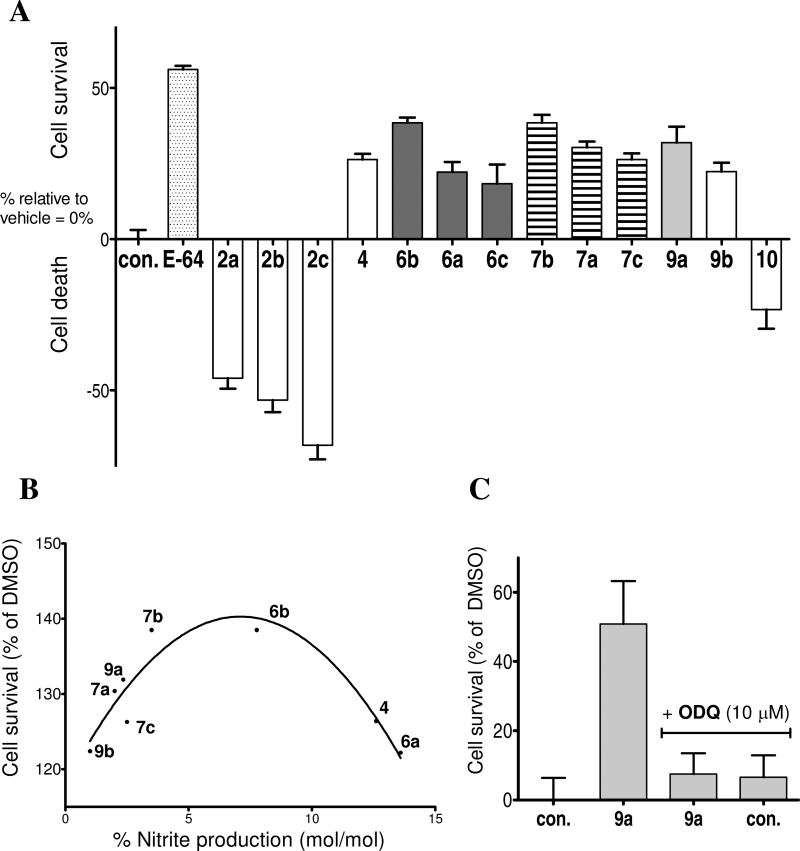
A) Effect of selected furoxans on cell survival in primary rat cortical neurons. Cells treated with compound (50 μM) for 24 h following 2 h of OGD. Values represent survival as % of DMSO treated control from MTT assay. B) Tentative correlation between NO2- production (% mol/mol) and cell survival (% of control). C) Effect of cell survival in primary rat cortical neurons by DMSO treated control, the furoxan 9a (50 μM), 9a (50 μM) + ODQ (10 μM), and ODQ (10 μM) treated control Values represent survival as % of DMSO treated control from MTT assay.

