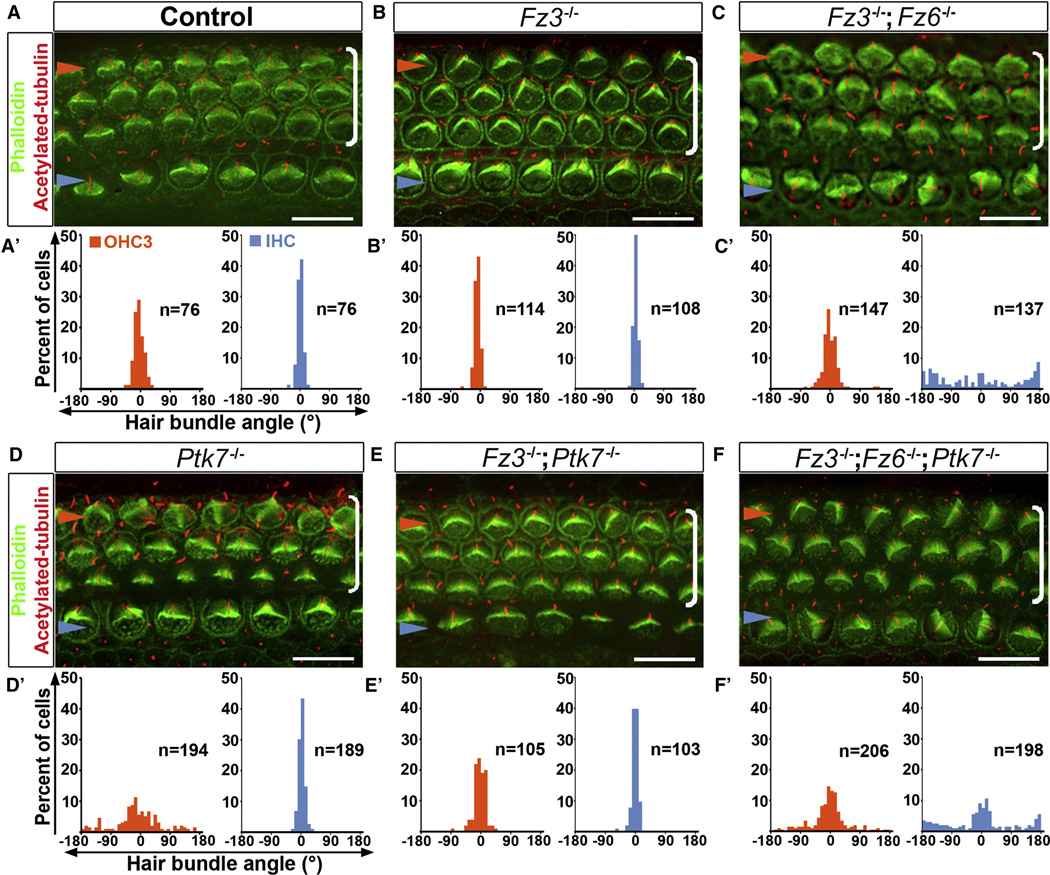
Figure 2. Epistasis analysis of Ptk7 and Fz3/Fz6 in hair cell PCP.
(A–F) Basal region (15% cochlear length) of E18.5 cochleae stained with phalloidin (green) and acetylated tubulin (red) to visualize the stereocilia and the kinocilium, respectively. Genotypes are indicated above the panels. (A’–F’) Quantification of bundle orientation in OHC3 (orange bars) and IHC (blue bars) rows for the indicated genotypes. In control (A, A’) and Fz3−/− cochleae (B, B’), OHC3 and IHC bundle orientation do not deviate beyond 30° from the medial-lateral axis. (C, C’) In Fz3−/−; Fz6−/− mutants, the bundle orientation defect was most pronounced in IHCs. (D, D’) In Ptk7−/− mutants, bundle orientation defects were most pronounced in OHC3s. (E, E’) In Fz3−/−; Ptk7−/− mutants, bundle orientation in OHC3s was significantly improved compared to Ptk7−/− mutants. (F, F’) Fz3−/−; Fz6−/−; Ptk7−/− triple mutants displayed an additive defect in bundle orientation. Blue arrowheads indicate the row of IHCs, orange arrowheads indicate the OHC3 row and brackets indicate all OHC rows. Lateral is up in all micrographs. Scale bar: 10 μm. (See also Figure S2).

