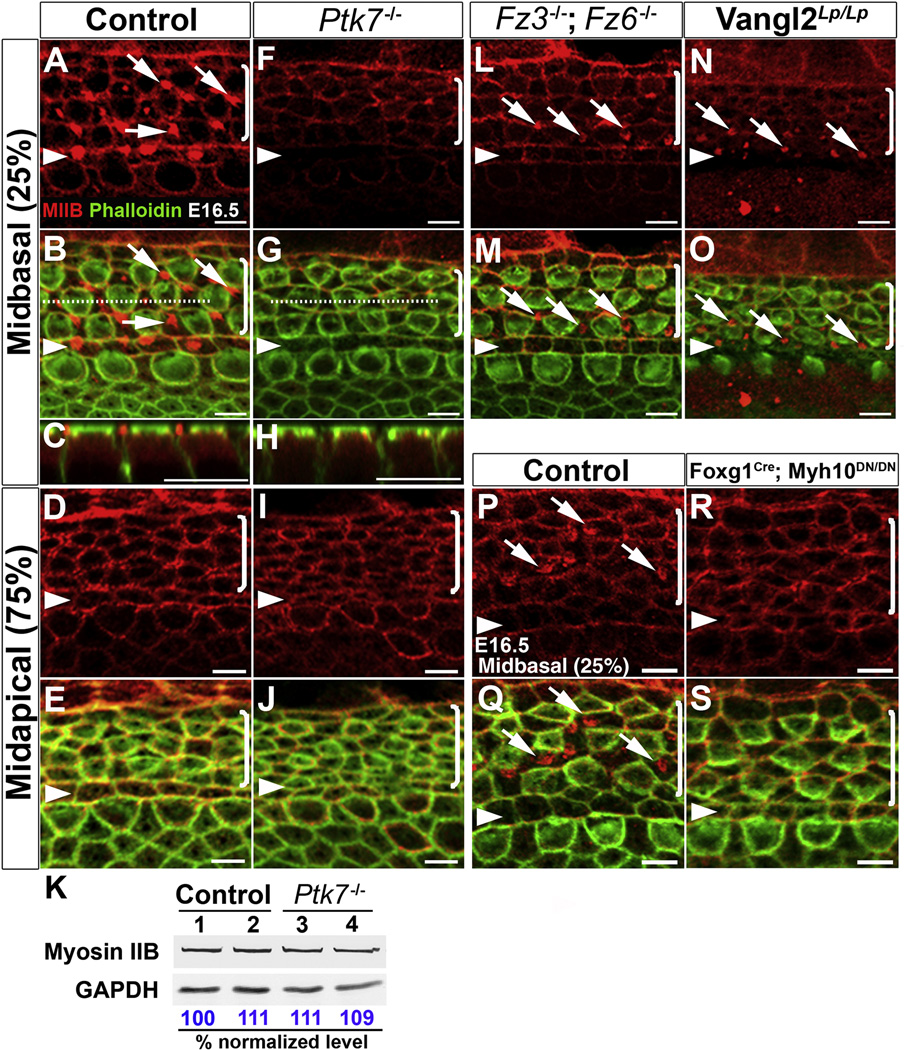
Figure 5. PTK7 and the noncanonical Wnt pathway differentially regulate a contractile myosin IIB network in supporting cells.
(A–J, L–S) Confocal images of MIIB (red) and phalloidin (green) staining in the OC at E16.5. (A–E) In the control OC, MIIB is localized to cell-cell contacts and to apical foci in the supporting cells in the mid-basal region of the OC (A–C). (F–J) In Ptk7−/− OC, apical MIIB foci were absent from supporting cells (F–H) and overall junctional MIIB staining was reduced. (C, H) Z projections along the dashed lines in B and G, respectively, showing the apical position of the MIIB foci in supporting cells. (K) Total levels of MIIB in E16.5 Ptk7−/− cochleae were comparable to controls. Lysates from four cochleae of the same genotype were pooled and loaded in each lane. GAPDH served as loading control. Numbers on the bottom indicate percentage of normalized levels. (L–O) Apical MIIB foci (arrows) were still present in the supporting cells of Fz3−/−; Fz6−/− (L, M) and Vangl2Lp/Lp (N, O) mutants, albeit smaller in size. (P–Q) Wild-type MIIB is localized to cell-cell contacts and apical foci in supporting cells (arrows). (R–S) ATPase-deficient MIIB (R709C) was localized to cell-cell contacts but failed to assemble into apical foci in supporting cells. Percentages indicate the distance of the positions analyzed from the base relative to the length of the cochlea. Arrowheads indicate the row of pillar cells. Brackets indicate OHC rows. Lateral is up in all micrographs. Scale bars, A–J, L–S, 5 µm.

