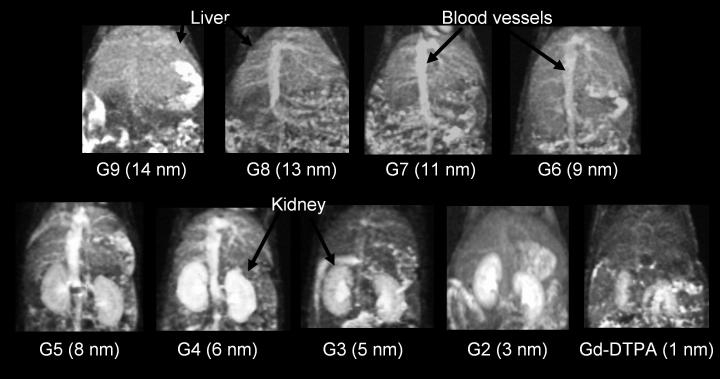
Figure 3.
3D-maximum intensity projection display of T1-weighted MR images of the abdomen at 15 min post-injection for G9, G8, G7, and G6 and at 3 min after injection for G5, G4, G3, G2, and DTPA are shown. Kidneys are shown with agents of G5 (8 nm in diameter) or smaller. Blood pool is clearly depicted G5 (8 nm) and G4 (5 nm) at 3 min post-injection because of partial and slow glomerular filtration. Kidneys are not shown with agents G6 (9 nm in diameter) or larger even at 15 min post-injection. Intensities in the liver increase as the agent sizes increase.

