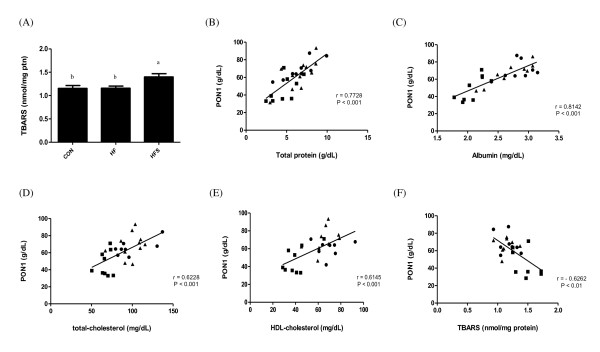
Figure 1.
(A) Liver TBARS levels; scatter plots illustrating the association between (B) PON1 and total protein and (C) albumin and (D) Total cholesterol and (E) HDL-cholesterol and (F) TBARS in experimental groups. Control (dark filled circle); high-fructose (dark filled triangle) and high-fructose + salt (dark filled square) rats. High-density lipoprotein (HDL); paraoxonase1 activity (PON1).

