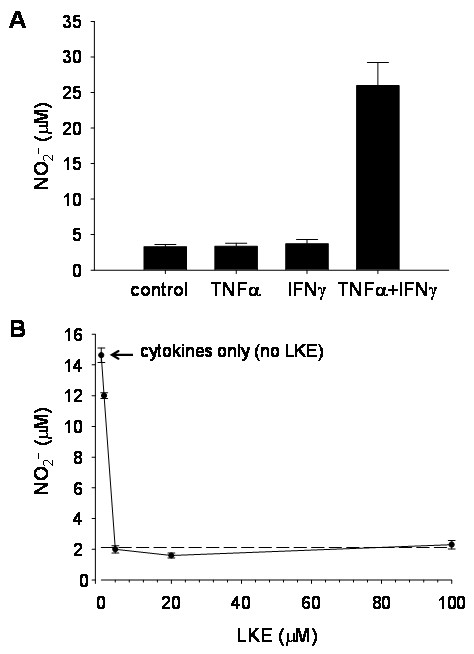
Figure 1.
·NO production in EOC-20 cells.A, EOC-20 microglia stimulated only with TNF + IFNγ in combination. Each error bar represents mean ± SEM from six wells of a typical experiment. B, LKE inhibits cytokine-stimulated ·NO production in EOC-20 microglia challenged with 40 ηg/mL TNF + 40 ng/mL IFNγ. Each point represents mean ± SEM from four wells of a typical experiment. SEM, standard error of the mean.

