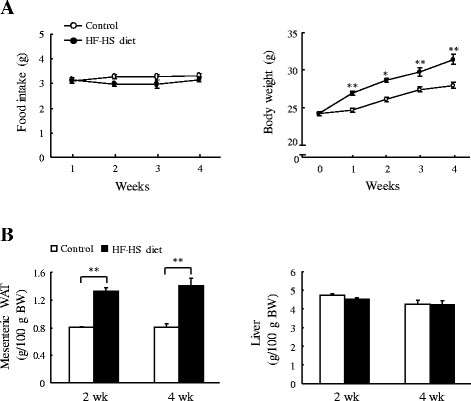
Figure 1.
Changes in body, white adipose tissue (WAT), and liver weights. Food intake and body weight (A) and mesenteric WAT and liver weights (B) are shown. HF–HS diet: high fat–high sucrose diet. C57BL/6 J mice were fed standard chow diet or the HF–HS diet (milk fat 21% and sucrose 34%) for 2 or 4 weeks. Values are the mean ± SE, n = 6. *P < 0.05; **P < 0.01.

