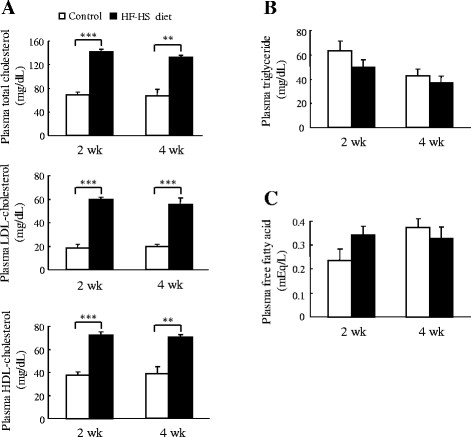
Figure 2.
Effect of the HF–HS diet on the plasma lipid profile. Plasma levels of cholesterol (total cholesterol, LDL–cholesterol, and HDL–cholesterol) (A), triglycerides (B), and free fatty acids (C) are shown. HF–HS diet: high fat–high sucrose diet. C57BL/6 J mice were fed standard chow diet or the HF–HS diet (milk fat 21% and sucrose 34%) for 2 or 4 weeks. Values are the mean ± SE, n = 6. ** P < 0.01; *** P < 0.001.

